 |
Melton Hockey Club |
|
Last updated : 10:07 am - 2 November 2023

Club Cap : 387
(Games : 209, Goals : 68 )
First XI Men's Cap : 110
(Games : 11, Goals : 0)
Games Umpired : 18
(Senior : 1, Veteran : 8, Junior : 9)
Milestones
| 1996-May-04 : | First Senior game (Yarra Valley 3 def. Melton 1. R-02: 1996 Metro 3 West Men) |
| 1996-May-04 : | First game (Yarra Valley 3 def. Melton 1. R-02: 1996 Metro 3 West Men) |
| 1998-Mar-28 : | First Junior game (Brunswick 1 def. Melton 0. R-01: 1998 U11 North) |
| 1998-Aug-08 : | First goal scored (Melton 9 def. Yarra Valley 0. R-17: 1998 U11 North) |
| 2001-Jun-29 : | 50 Junior games (Melton 5 def. Essendon (B) 0. R-12: 2001 U15 North) |
| 2002-Jul-20 : | First Senior goal (Melton 11 def. RMIT 0. R-12: 2002 Metro 4 West Men) |
| 2003-Aug-23 : | First First XI Mens game (St.Bedes 2 def. Melton 1. R-17: 2003 State League 5 Men) |
| 2004-Jul-23 : | 100 Junior games (Melton 1 def. Greensborough 0. R-13: 2004 U17) |
| 2004-Sep-10 : | Last Junior game (Melton 3 def. Yarra Valley 2. GF: 2004 U17) |
| 2005-Apr-25 : | First game umpired (Melton 3 def. Elwood 0. R-02: 2005 Veterans C West) |
| 2005-Jul-02 : | Last First XI Mens game played (Melton 2 drew St.Bedes 2. R-11: 2005 State League 5 Men) |
| 2006-Sep-23 : | Last Senior game (Melton 2 def. Brunswick (W) 3. GF: 2006 Metro 4 West Men) |
| 2006-Sep-23 : | Last game played (Melton 2 def. Brunswick (W) 3. GF: 2006 Metro 4 West Men) |
| 2008-May-03 : | Last game umpired (MUHC 7 def. Melton 0. R-03: 2008 Metro 3 West Men) |
Honours, Trophies, and Official Roles
| Top Junior Scorer (Win.) : | 2003/04 |
| B&F Runner Up : | 2004-U17, 2006-Metro 4 West Men |
| Coach's Award : | 2003-U17 Pennant North |
| Manager : | 2005-U17 North |
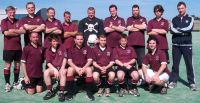
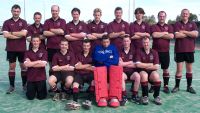
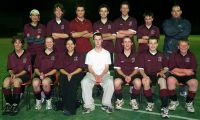
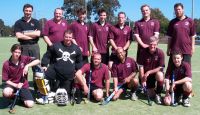
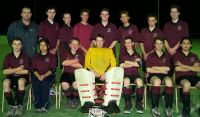
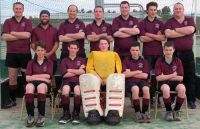
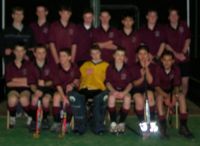
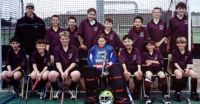
Team Photographs

Complete Playing History
Teams played with : 17
Premierships won : 3
Wooden Spoons : 1
| Games as Player |
Games Won | Games Drawn | Games Lost | Total | Goals | Goalscoring Average |
|---|---|---|---|---|---|---|
| Junior Winter | 63 | 7 | 37 | 107 | 43 | 0.406 |
| Senior Winter | 74 | 9 | 19 | 102 | 25 | 0.245 |
| Total | 137 | 16 | 56 | 209 | 68 | 0.327 |
| Pos. | PR/WS | Div. | Competition | Games | Goals | Avge. | Won | Drawn | Lost | Avge.For | Avge.Aga | Avge.Diff | G.For | G.Aga | GoalDiff |
|---|---|---|---|---|---|---|---|---|---|---|---|---|---|---|---|
| 1 | 2006 Metro 3 West Men* | 3 | 1 | 0.333 | 2 | 1 | 4.000 | 1.000 | +3.000 | 12 | 3 | +009 | |||
| 1 | PR | 2006 Metro 4 West Men* | 16 | 9 | 0.563 | 15 | 1 | 3.750 | 1.563 | +2.188 | 60 | 25 | +035 | ||
| 2 | 2005 State League 5 Men* | 7 | 6 | 1 | 3.429 | 1.286 | +2.143 | 24 | 9 | +015 | |||||
| 4 | 2005 Metro 3 West Men* | 17 | 5 | 0.294 | 11 | 3 | 3 | 3.412 | 1.471 | +1.941 | 58 | 25 | +033 | ||
| 9 | 2004 State League 4 Men* | 3 | 3 | 0.667 | 3.000 | -2.333 | 2 | 9 | -007 | ||||||
| 2 | 2004 Metro 3 West Men* | 17 | 6 | 0.353 | 12 | 3 | 2 | 5.118 | 2.000 | +3.118 | 87 | 34 | +053 | ||
| 1 | PR | 2004 U17* | 20 | 22 | 1.100 | 18 | 2 | 4.500 | 0.800 | +3.700 | 90 | 16 | +074 | ||
| 3 | 2003 State League 5 Men* | 1 | 1 | 1.000 | 2.000 | -1.000 | 1 | 2 | -001 | ||||||
| 2 | 2003 Metro 4 West Men* | 20 | 1 | 0.050 | 16 | 4 | 6.850 | 2.150 | +4.700 | 137 | 43 | +094 | |||
| 6 | 2003 U17 Pennant North* | 15 | 1 | 0.071 | 3 | 3 | 9 | 2.133 | 3.067 | -0.933 | 32 | 46 | -014 | ||
| 3 | 2002 Metro 4 West Men* | 17 | 3 | 0.176 | 12 | 5 | 6.176 | 2.588 | +3.588 | 105 | 44 | +061 | |||
| 4 | 2002 U17 North* | 17 | 2 | 0.118 | 7 | 10 | 3.000 | 2.765 | +0.235 | 51 | 47 | +004 | |||
| 5 | 2001 U15 North* | 16 | 5 | 0.313 | 9 | 1 | 6 | 3.000 | 2.125 | +0.875 | 48 | 34 | +014 | ||
| -1 | WS | 2000 U17 North | 2 | 2 | 0.000 | 18.500 | -18.500 | 0 | 37 | -037 | |||||
| 2 | 1999 U13 North* | 20 | 9 | 0.450 | 14 | 1 | 5 | 5.900 | 0.900 | +5.000 | 118 | 18 | +100 | ||
| 1 | PR | 1998 U11 North* | 17 | 4 | 0.235 | 12 | 2 | 3 | 3.706 | 0.353 | +3.353 | 63 | 6 | +057 | |
| 8 | 1996 Metro 3 West Men* | 1 | 1 | 1.000 | 3.000 | -2.000 | 1 | 3 | -002 | ||||||
| 209 | 68 | 0.327 | 137 | 16 | 56 | 4.606 | 1.919 | +2.335 | 889 | 401 | +488 |
Goalkeeping History
| Games as Goalkeeper |
Games Won | Games Drawn | Games Lost | Total | Shut outs |
Shutout Average |
Goals Against |
G.A. Avg. |
|---|---|---|---|---|---|---|---|---|
| Junior Winter | 1 | 0 | 0 | 1 | 1 | 1.000 | 0 | 0.000 |
| Pos. | Div. | Competition | Games | Won | Drawn | Lost | Shutouts | % | Goals In | Avge. | GoalDiff |
|---|---|---|---|---|---|---|---|---|---|---|---|
| 6 | 2003 U17 Pennant North* | 1 | 1 | 1 | 100% | 0.000 | +009 |
Umpiring History
Year    Division                      SEN VET JUN
2005    U17 North                               2
2005    U17 Pennant North                       2
2005    Veterans C West                     7
2006    U17 North                               5
2006    Veterans C West                     1
2008    Metro 3 West Men                1

SUBTOTAL                                1   8   9
TOTAL                                          18
Junior Winter Playing History
| Games as Player |
Games Won | Games Drawn | Games Lost | Total | Goals | Goalscoring Average |
|---|---|---|---|---|---|---|
| Junior Winter | 63 | 7 | 37 | 107 | 43 | 0.406 |
| First Game : | Brunswick 1 def. Melton 0. R-01: 1998 U11 North |
| Last Game : | Melton 3 def. Yarra Valley 2. GF: 2004 U17 |
| Best Win : | Melton 17 def. MHSOB 0. R-14: 1999 U13 North |
| Worst Loss : | Kew 21 def. Melton 0. R-02: 2000 U17 North |
| 1 goal games : | 9 times. Last : Melton 4 def. Eastern 0. R-17: 2004 U17 |
| 2 goal games : | 10 times. Last : Melton 3 def. Yarra Valley 2. GF: 2004 U17 |
| 3 goal games : | 3 times. Last : Melton 8 def. Sandringham 1. R-07: 2004 U17 |
| 5 goal games : | 1 times. Last : Melton 9 def. Hawthorn 0. R-01: 1999 U13 North |
| Finals : | Melton 4 def. Greensborough 0. GF: 1998 U11 North Melton 3 def. Essendon 0. SF: 1998 U11 North Essendon (1) 3 def. Melton 2. GF: 1999 U13 North Melton 1 def. Essendon (2) 0. SF: 1999 U13 North Brunswick (2) 6 def. Melton 0. SF: 2002 U17 North Melton 3 def. Yarra Valley 2. GF: 2004 U17 Melton 1 def. Camberwell 1. SF: 2004 U17 |
| Premierships : | Melton 4 def. Greensborough 0. GF: 1998 U11 North Melton 3 def. Yarra Valley 2. GF: 2004 U17 |
Senior Winter Playing History
| Games as Player |
Games Won | Games Drawn | Games Lost | Total | Goals | Goalscoring Average |
|---|---|---|---|---|---|---|
| Senior Winter | 74 | 9 | 19 | 102 | 25 | 0.245 |
| First Game : | Yarra Valley 3 def. Melton 1. R-02: 1996 Metro 3 West Men |
| Last Game : | Melton 2 def. Brunswick (W) 3. GF: 2006 Metro 4 West Men |
| Best Win : | Melton 21 def. MUHC (B) 0. R-15: 2003 Metro 4 West Men |
| Worst Loss : | Elwood 7 def. Melton 2. R-02: 2002 Metro 4 West Men |
| 1 goal games : | 16 times. Last : Melton 1 def. St.Bernards 1. SF: 2006 Metro 4 West Men |
| 2 goal games : | 3 times. Last : Melton 6 def. Yarra Valley 2. R-06: 2006 Metro 4 West Men |
| 3 goal games : | 1 times. Last : Melton 5 def. Greensborough 4. R-15: 2006 Metro 4 West Men |
| Finals : | Greensborough 3 def. Melton 2. PF: 2002 Metro 4 West Men Melton 12 def. Altona 0. SF: 2002 Metro 4 West Men Essendon 4 def. Melton 0. GF: 2003 Metro 4 West Men Melton 6 def. Old Melburnians 2. PF: 2003 Metro 4 West Men Essendon 4 def. Melton 4. SF: 2003 Metro 4 West Men Brunswick 2 def. Melton 1. GF: 2004 Metro 3 West Men Melton 6 def. Essendon 4. SF: 2004 Metro 3 West Men Old Melburnians 1 def. Melton 0. SF: 2005 Metro 3 West Men Melton 2 def. Brunswick (W) 3. GF: 2006 Metro 4 West Men Melton 1 def. St.Bernards 1. SF: 2006 Metro 4 West Men |
| Premierships : | Melton 2 def. Brunswick (W) 3. GF: 2006 Metro 4 West Men |
Teammates
Number of teammates :95
| Player |
Games |
Win % | Draw % | Loss % | Unkn % | Avge. Points |
Avge. For | Avge. Aga | Avge. Diff. |
|---|---|---|---|---|---|---|---|---|---|
| Arnold, Andrew* | 161 | 66% | 7% | 27% | 2.062 | 4.503 | 1.876 | +2.627 | |
| Darcy, Astin* | 153 | 61% | 8% | 30% | 1.928 | 4.536 | 1.908 | +2.627 | |
| Brazil, Sean* | 111 | 57% | 7% | 36% | 1.775 | 3.973 | 1.874 | +2.099 | |
| May, Adrian* | 103 | 56% | 9% | 35% | 1.777 | 4.233 | 1.825 | +2.408 | |
| Slocombe, Morgan* | 99 | 58% | 7% | 35% | 1.798 | 3.707 | 1.808 | +1.899 | |
| Strobel, Joshua* | 88 | 53% | 8% | 39% | 1.682 | 3.693 | 1.830 | +1.864 | |
| Darcy, Thurston* | 81 | 62% | 10% | 28% | 1.951 | 4.247 | 1.654 | +2.593 | |
| Lawrence, Tony* | 72 | 72% | 8% | 19% | 2.250 | 5.431 | 2.042 | +3.389 | |
| York, Mitchell* | 67 | 60% | 6% | 34% | 1.851 | 3.925 | 1.493 | +2.433 | |
| Dempsey, Michael* | 64 | 48% | 11% | 41% | 1.563 | 3.391 | 2.438 | +0.953 | |
| MacKinnon, Tim* | 57 | 70% | 7% | 23% | 2.175 | 5.579 | 2.140 | +3.439 | |
| Kovarik, Hans* | 55 | 69% | 13% | 18% | 2.200 | 4.945 | 1.909 | +3.036 | |
| Shadbolt, Ron* | 54 | 72% | 11% | 17% | 2.278 | 5.241 | 1.815 | +3.426 | |
| Baxter, Adrian* | 50 | 62% | 6% | 32% | 1.920 | 4.500 | 1.280 | +3.220 | |
| Rewkiewicz, Casey* | 47 | 40% | 9% | 51% | 1.298 | 2.723 | 2.596 | +0.128 | |
| Leslie, Darren* | 45 | 38% | 7% | 56% | 1.200 | 2.578 | 2.733 | -0.156 | |
| Edwards, Jeremy* | 43 | 58% | 7% | 35% | 1.814 | 3.791 | 1.837 | +1.953 | |
| Bluschke, Alf* | 41 | 71% | 17% | 12% | 2.293 | 5.268 | 1.537 | +3.732 | |
| Cook, Stuart* | 38 | 66% | 8% | 26% | 2.053 | 4.526 | 2.184 | +2.342 | |
| Arnold, Chris* | 35 | 63% | 3% | 34% | 1.914 | 5.114 | 3.143 | +1.971 | |
| Downs, Andrew* | 34 | 79% | 9% | 12% | 2.471 | 3.706 | 0.941 | +2.765 | |
| Huntley, Nick* | 34 | 65% | 6% | 29% | 2.000 | 4.794 | 1.441 | +3.353 | |
| Dine, Brenton* | 34 | 79% | 9% | 12% | 2.471 | 4.118 | 1.118 | +3.000 | |
| Matthews, Ben* | 33 | 91% | 3% | 6% | 2.758 | 4.242 | 1.152 | +3.091 | |
| Cross, Tim* | 32 | 72% | 9% | 19% | 2.250 | 4.938 | 0.656 | +4.281 | |
| Burmistrow, Brendan | 29 | 76% | 7% | 17% | 2.345 | 5.483 | 0.621 | +4.862 | |
| Self, Ryan* | 29 | 83% | 7% | 10% | 2.552 | 4.586 | 1.000 | +3.586 | |
| Lawrence, Daryl* | 28 | 68% | 4% | 29% | 2.071 | 6.071 | 2.429 | +3.643 | |
| Mumford, Matthew* | 28 | 82% | 7% | 11% | 2.536 | 3.857 | 0.857 | +3.000 | |
| Irvine, Andrew* | 25 | 68% | 8% | 24% | 2.120 | 5.600 | 2.320 | +3.280 | |
| Falcao, Hip* | 25 | 80% | 4% | 16% | 2.440 | 4.520 | 2.160 | +2.360 | |
| Downs, David* | 24 | 71% | 4% | 25% | 2.167 | 4.625 | 1.875 | +2.750 | |
| Cautley, Mark* | 24 | 79% | 21% | 2.375 | 7.583 | 2.208 | +5.375 | ||
| Spence, Dion* | 23 | 78% | 13% | 9% | 2.478 | 4.000 | 1.826 | +2.174 | |
| Williams, Mark* | 22 | 82% | 5% | 14% | 2.500 | 5.227 | 1.364 | +3.864 | |
| Holahan, Zac* | 21 | 95% | 5% | 2.857 | 4.762 | 1.095 | +3.667 | ||
| Lawrence, Glenn* | 21 | 67% | 10% | 24% | 2.095 | 3.571 | 1.667 | +1.905 | |
| Mouanoutoua, Edward* | 20 | 75% | 5% | 20% | 2.300 | 5.900 | 0.800 | +5.100 | |
| Spence, Jessica* | 20 | 90% | 10% | 2.700 | 4.500 | 0.800 | +3.700 | ||
| Cameron, John* | 19 | 63% | 16% | 21% | 2.053 | 3.474 | 1.526 | +1.947 | |
| Kasprzak, Alex* | 19 | 89% | 11% | 2.684 | 4.526 | 0.842 | +3.684 | ||
| Bonney, Michael* | 19 | 95% | 5% | 2.842 | 4.737 | 0.737 | +4.000 | ||
| Lawrence, Stephen* | 18 | 78% | 17% | 6% | 2.500 | 4.556 | 1.500 | +3.056 | |
| Cox, Caitlyn* | 18 | 94% | 6% | 2.833 | 4.444 | 0.778 | +3.667 | ||
| Govan, Jeff* | 17 | 88% | 6% | 6% | 2.706 | 6.412 | 1.765 | +4.647 | |
| Spence, Adam* | 17 | 88% | 6% | 6% | 2.706 | 3.529 | 1.588 | +1.941 | |
| Kearney, Damien* | 16 | 56% | 6% | 38% | 1.750 | 3.000 | 2.125 | +0.875 | |
| Mico, David* | 16 | 56% | 6% | 38% | 1.750 | 3.000 | 2.125 | +0.875 | |
| Haycock, John* | 16 | 94% | 6% | 2.875 | 3.750 | 1.563 | +2.188 | ||
| Noonan, Kristian* | 15 | 73% | 27% | 2.467 | 4.333 | 1.333 | +3.000 | ||
| Baker, Daniel* | 15 | 93% | 7% | 2.867 | 3.667 | 1.600 | +2.067 | ||
| Hoad, Simon* | 15 | 93% | 7% | 2.867 | 3.800 | 1.533 | +2.267 | ||
| Dyke, Leanne* | 14 | 21% | 21% | 57% | 0.857 | 2.214 | 2.857 | -0.643 | |
| Baker, Gavin* | 14 | 93% | 7% | 2.857 | 3.643 | 1.571 | +2.071 | ||
| Stanyer, Adrian* | 13 | 46% | 8% | 46% | 1.462 | 2.077 | 4.385 | -2.308 | |
| Gilham, Mark* | 13 | 62% | 23% | 15% | 2.077 | 4.462 | 2.077 | +2.385 | |
| Brierley, John* | 13 | 92% | 8% | 2.846 | 3.538 | 1.538 | +2.000 | ||
| Alvarez, Michael* | 12 | 67% | 17% | 17% | 2.167 | 4.250 | 0.333 | +3.917 | |
| Fragopoulos, Peter* | 12 | 75% | 25% | 2.250 | 6.083 | 2.500 | +3.583 | ||
| Rihs, Daniel* | 12 | 58% | 8% | 33% | 1.833 | 2.917 | 1.833 | +1.083 | |
| Goodwin, Leigh* | 12 | 75% | 25% | 2.250 | 3.333 | 1.167 | +2.167 | ||
| Sorensen, Steven* | 11 | 55% | 9% | 36% | 1.727 | 2.455 | 1.818 | +0.636 | |
| McMurray, Jason* | 10 | 40% | 60% | 1.200 | 2.500 | 2.500 | +0.000 | ||
| Powderly, Phillip* | 10 | 60% | 10% | 30% | 1.900 | 2.600 | 1.800 | +0.800 | |
| Hocking, Branton* | 10 | 90% | 10% | 2.800 | 4.000 | 1.300 | +2.700 | ||
| Lang, Joshua* | 10 | 100% | 3.000 | 3.200 | 1.700 | +1.500 | |||
| Hanley-Wood, Ben* | 9 | 56% | 22% | 22% | 1.889 | 3.111 | 1.667 | +1.444 | |
| Graetz, Jeff* | 8 | 75% | 25% | 2.250 | 5.875 | 1.875 | +4.000 | ||
| McLaren, Scott* | 8 | 75% | 13% | 13% | 2.375 | 3.000 | 1.500 | +1.500 | |
| Adler, Mathew | 7 | 57% | 14% | 29% | 1.857 | 2.857 | 0.429 | +2.429 | |
| Jennings, Ian* | 6 | 33% | 67% | 1.000 | 4.167 | 3.000 | +1.167 | ||
| Cronje, Micheal* | 6 | 50% | 50% | 1.500 | 3.167 | 2.500 | +0.667 | ||
| Granville, Alan* | 6 | 33% | 17% | 50% | 1.167 | 2.333 | 1.667 | +0.667 | |
| Crebbin, Jason* | 4 | 100% | 0.000 | 0.750 | 2.750 | -2.000 | |||
| Arnold, David* | 4 | 50% | 25% | 25% | 1.750 | 3.000 | 1.500 | +1.500 | |
| Eley, Clive* | 3 | 33% | 33% | 33% | 1.333 | 4.000 | 2.667 | +1.333 | |
| Kari, Grant* | 3 | 67% | 33% | 2.333 | 5.333 | 1.333 | +4.000 | ||
| Freeman, Brent | 2 | 100% | 0.000 | 0.000 | 18.500 | -18.500 | |||
| Lau, Derrick | 2 | 100% | 0.000 | 0.000 | 18.500 | -18.500 | |||
| Mackay, Catherine* | 2 | 100% | 0.000 | 0.000 | 18.500 | -18.500 | |||
| Pisani, Sandy* | 2 | 100% | 0.000 | 0.000 | 18.500 | -18.500 | |||
| Vinco, Herbert* | 2 | 100% | 0.000 | 0.000 | 18.500 | -18.500 | |||
| Cook, Lorraine* | 2 | 50% | 50% | 1.500 | 5.000 | 4.500 | +0.500 | ||
| Greed, Justin* | 2 | 100% | 3.000 | 4.500 | 0.000 | +4.500 | |||
| Hardy, Dale* | 2 | 50% | 50% | 2.000 | 3.500 | 2.000 | +1.500 | ||
| Vallance, Liam* | 2 | 100% | 3.000 | 4.500 | 1.000 | +3.500 | |||
| Bedggood, Stephen* | 1 | 100% | 0.000 | 1.000 | 3.000 | -2.000 | |||
| Blake, Alex* | 1 | 100% | 0.000 | 1.000 | 3.000 | -2.000 | |||
| Lawrence, Geoffrey* | 1 | 100% | 0.000 | 1.000 | 3.000 | -2.000 | |||
| MacKinnon, John* | 1 | 100% | 0.000 | 1.000 | 3.000 | -2.000 | |||
| McNair, Anthony* | 1 | 100% | 0.000 | 1.000 | 3.000 | -2.000 | |||
| O`Conner, Kristy* | 1 | 100% | 0.000 | 0.000 | 21.000 | -21.000 | |||
| Williams, Lesley* | 1 | 100% | 3.000 | 9.000 | 3.000 | +6.000 | |||
| Grant-Taylor, Sandy* | 1 | 100% | 3.000 | 2.000 | 0.000 | +2.000 | |||
| Kovarik, John* | 1 | 100% | 3.000 | 2.000 | 1.000 | +1.000 |
Opposition Teams
| Opponent |
Games |
Goals | Avge |
Win % | Draw % | Loss % | Unkn % | Avge. Points |
Avge. For | Avge. Aga | Avge. Diff. |
G.K. Games | Shut- outs | Shut- out % | Goals In | Goals Avge |
|---|---|---|---|---|---|---|---|---|---|---|---|---|---|---|---|---|
| Brunswick | 24 | 4 | 0.167 | 54% | 46% | 1.625 | 2.958 | 3.042 | -0.083 | |||||||
| Essendon | 23 | 3 | 0.130 | 57% | 13% | 30% | 1.826 | 3.609 | 1.957 | +1.652 | 1 | 1 | 100% | 0 | 0.000 | |
| Greensborough | 19 | 10 | 0.526 | 68% | 32% | 2.053 | 3.474 | 1.947 | +1.526 | |||||||
| Yarra Valley | 17 | 11 | 0.647 | 82% | 18% | 2.471 | 3.647 | 1.353 | +2.294 | |||||||
| Werribee | 14 | 4 | 0.286 | 79% | 7% | 14% | 2.429 | 5.071 | 1.000 | +4.071 | ||||||
| Camberwell | 10 | 1 | 0.100 | 40% | 60% | 1.200 | 2.900 | 2.400 | +0.500 | |||||||
| Altona | 10 | 4 | 0.400 | 60% | 20% | 20% | 2.000 | 3.700 | 1.100 | +2.600 | ||||||
| RMIT | 8 | 1 | 0.125 | 88% | 13% | 2.625 | 6.875 | 1.000 | +5.875 | |||||||
| MUHC | 8 | 2 | 0.250 | 88% | 13% | 2.625 | 8.500 | 1.750 | +6.750 | |||||||
| Old Melburnians | 8 | 1 | 0.125 | 50% | 50% | 1.500 | 3.750 | 3.500 | +0.250 | |||||||
| Reservoir | 7 | 57% | 43% | 2.143 | 2.286 | 0.571 | +1.714 | |||||||||
| Footscray | 6 | 1 | 0.167 | 50% | 33% | 17% | 1.833 | 4.167 | 2.167 | +2.000 | ||||||
| MHSOB | 5 | 3 | 0.600 | 100% | 3.000 | 10.000 | 0.400 | +9.600 | ||||||||
| Box Hill | 5 | 2 | 0.400 | 60% | 40% | 1.800 | 5.400 | 2.400 | +3.000 | |||||||
| Kew | 4 | 75% | 25% | 2.250 | 5.750 | 5.250 | +0.500 | |||||||||
| Hawthorn | 4 | 5 | 1.250 | 75% | 25% | 2.250 | 8.000 | 0.750 | +7.250 | |||||||
| TEM | 4 | 25% | 25% | 50% | 1.000 | 3.000 | 2.500 | +0.500 | ||||||||
| St.Bernards | 4 | 3 | 0.750 | 75% | 25% | 2.500 | 2.250 | 1.500 | +0.750 | |||||||
| Ajax-Maccabi | 3 | 100% | 3.000 | 5.333 | 1.667 | +3.667 | ||||||||||
| St.Bedes | 3 | 33% | 33% | 33% | 1.333 | 2.000 | 2.000 | +0.000 | ||||||||
| Eastern | 3 | 3 | 1.000 | 67% | 33% | 2.000 | 2.667 | 1.000 | +1.667 | |||||||
| PEGS | 3 | 33% | 33% | 33% | 1.333 | 2.667 | 2.667 | +0.000 | ||||||||
| Elwood | 2 | 50% | 50% | 1.500 | 5.000 | 6.000 | -1.000 | |||||||||
| Waverley | 2 | 3 | 1.500 | 100% | 3.000 | 8.500 | 0.500 | +8.000 | ||||||||
| Sandringham | 2 | 5 | 2.500 | 100% | 3.000 | 8.000 | 1.500 | +6.500 | ||||||||
| SNP | 2 | 1 | 0.500 | 100% | 3.000 | 7.000 | 0.500 | +6.500 | ||||||||
| Old Yarra | 2 | 100% | 3.000 | 2.000 | 1.000 | +1.000 | ||||||||||
| Doncaster | 1 | 1 | 1.000 | 100% | 1.000 | 3.000 | 3.000 | +0.000 | ||||||||
| Sth. Knights | 1 | 100% | 0.000 | 1.000 | 4.000 | -3.000 | ||||||||||
| Casey | 1 | 100% | 0.000 | 1.000 | 2.000 | -1.000 | ||||||||||
| Mornington | 1 | 100% | 3.000 | 2.000 | 0.000 | +2.000 | ||||||||||
| Old Carey | 1 | 100% | 3.000 | 6.000 | 1.000 | +5.000 | ||||||||||
| Old Haileybury | 1 | 100% | 3.000 | 7.000 | 2.000 | +5.000 | ||||||||||
| Powerhouse | 1 | 100% | 3.000 | 4.000 | 0.000 | +4.000 | ||||||||||
| Opponents :34 | 209 | 68 | 0.325 | 66% | 8% | 27% | 2.043 | 4.254 | 1.919 | +2.335 | 1 | 1 | 100% | 0 | 0.000 |
Playing Venues
| Venue | Games |
Goals | Avge. |
Win % | Draw % | Loss % | Unkn % | Avge. Points |
Avge. For | Avge. Aga | Avge. Diff. |
G.K. Games | Shut- outs | Shut- out % | Goals In | Goals Avge. |
|---|---|---|---|---|---|---|---|---|---|---|---|---|---|---|---|---|
| Melton Mowbray | 91 | 33 | 0.363 | 75% | 7% | 19% | 2.308 | 5.022 | 1.484 | +3.538 | 1 | 1 | 100% | 0 | 0.000 | |
| Footscray | 23 | 5 | 0.217 | 48% | 9% | 43% | 1.522 | 3.348 | 2.130 | +1.217 | ||||||
| Essendon | 13 | 69% | 8% | 23% | 2.154 | 4.769 | 1.846 | +2.923 | ||||||||
| SHC | 11 | 5 | 0.455 | 64% | 9% | 27% | 2.000 | 4.091 | 1.545 | +2.545 | ||||||
| Hawthorn | 10 | 2 | 0.200 | 60% | 40% | 1.800 | 4.200 | 2.700 | +1.500 | |||||||
| Greensborough | 9 | 5 | 0.556 | 56% | 44% | 1.667 | 2.556 | 2.444 | +0.111 | |||||||
| Yarra Velodrome | 7 | 3 | 0.429 | 71% | 29% | 2.143 | 4.429 | 1.286 | +3.143 | |||||||
| Reservoir | 6 | 1 | 0.167 | 67% | 17% | 17% | 2.167 | 2.500 | 3.000 | -0.500 | ||||||
| Altona | 6 | 3 | 0.500 | 33% | 33% | 33% | 1.333 | 2.000 | 4.500 | -2.500 | ||||||
| Werribee | 6 | 2 | 0.333 | 50% | 17% | 33% | 1.667 | 2.667 | 2.000 | +0.667 | ||||||
| Melbourne High | 4 | 4 | 1.000 | 75% | 25% | 2.250 | 6.500 | 2.250 | +4.250 | |||||||
| Albert Park | 3 | 100% | 3.000 | 4.000 | 1.667 | +2.333 | ||||||||||
| St.Bernards | 3 | 67% | 33% | 2.000 | 3.000 | 2.667 | +0.333 | |||||||||
| Yarra Valley | 3 | 1 | 0.333 | 67% | 33% | 2.000 | 3.000 | 2.000 | +1.000 | |||||||
| Elgar Park | 2 | 100% | 3.000 | 4.500 | 1.500 | +3.000 | ||||||||||
| Doncaster | 2 | 1 | 0.500 | 50% | 50% | 0.500 | 3.500 | 3.500 | +0.000 | |||||||
| Dandenong | 2 | 1 | 0.500 | 50% | 50% | 1.500 | 4.000 | 2.000 | +2.000 | |||||||
| PEGS | 2 | 50% | 50% | 0.500 | 2.000 | 2.500 | -0.500 | |||||||||
| Melbourne Uni | 1 | 100% | 0.000 | 5.000 | 6.000 | -1.000 | ||||||||||
| Monash | 1 | 100% | 3.000 | 6.000 | 2.000 | +4.000 | ||||||||||
| Waverley | 1 | 1 | 1.000 | 100% | 3.000 | 7.000 | 1.000 | +6.000 | ||||||||
| Knox | 1 | 1 | 1.000 | 100% | 3.000 | 4.000 | 0.000 | +4.000 | ||||||||
| Mentone | 1 | 100% | 3.000 | 3.000 | 2.000 | +1.000 | ||||||||||
| Melb Grammar | 1 | 100% | 0.000 | 0.000 | 3.000 | -3.000 | ||||||||||
| Venues :24 | 209 | 68 | 0.325 | 66% | 8% | 27% | 2.043 | 4.254 | 1.919 | +2.335 | 1 | 1 | 100% | 0 | 0.000 |