 |
Melton Hockey Club |
|
Last updated : 10:18 am - 2 November 2023
Club Cap : 309
(Games : 156, Goals : 0 )
First XI Men's Cap : 72
(Games : 35, Goals : 0)
Milestones
| 1992-Apr-11 : | First Junior game (Melton 10 def. Reservoir 0. R-01: 1992 U13 Pennant) |
| 1992-Apr-11 : | First game (Melton 10 def. Reservoir 0. R-01: 1992 U13 Pennant) |
| 1993-Nov-11 : | 50 Junior games (Melton 0 def. ???? 0. GF: 1993/94 U15 Altona) |
| 1994-Jul-10 : | First Senior game (Brunswick 2 def. Melton 0. R-11: 1994 Metro 2 West Men) |
| 1995-Jun-17 : | First First XI Mens game (Bendigo 5 def. Melton 0. R-07: 1995 State League 4 Men) |
| 1995-Aug-18 : | Last Junior game (Camberwell 3 def. Melton 2. SF: 1995 U17 North) |
| 1999-Jul-10 : | Last First XI Mens game played (Collegians-X 4 def. Melton 2. R-12: 1999 State League 4 Men) |
| 1999-Jul-10 : | Last game played (Collegians-X 4 def. Melton 2. R-12: 1999 State League 4 Men) |
| Playing career : 2646 days. (7 years and 91 days.) |
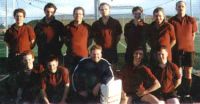
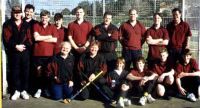
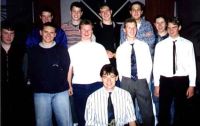
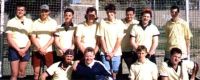
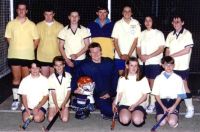
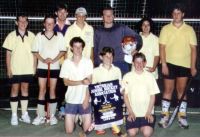
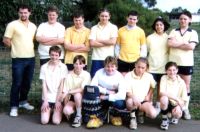
Team Photographs
Complete Playing History
Teams played with : 17
Premierships won : 1
Wooden Spoons : 1
| Games as Player |
Games Won | Games Drawn | Games Lost | Total |
|---|---|---|---|---|
| Junior Winter | 28 | 11 | 28 | 67 |
| Junior Summer | 14 | 0 | 2 | 16 |
| Junior Total | 42 | 11 | 30 | 83 |
| Senior Winter | 15 | 12 | 32 | 59 |
| Senior Summer | 3 | 1 | 10 | 14 |
| Senior Total | 18 | 13 | 42 | 73 |
| Total | 60 | 24 | 72 | 156 |
| Pos. | PR/WS | Div. | Competition | Games | Won | Drawn | Lost | Avge.For | Avge.Aga | Avge.Diff | G.For | G.Aga | GoalDiff |
|---|---|---|---|---|---|---|---|---|---|---|---|---|---|
| 8 | 1999 State League 4 Men* | 2 | 1 | 1 | 2.000 | 3.000 | -1.000 | 4 | 6 | -002 | |||
| 1 | 1998/99 Footscray Tue. Men* | 1 | 1 | 4.000 | 2.000 | +2.000 | 4 | 2 | +002 | ||||
| 8 | 1997 Metro 1 West Men* | 17 | 4 | 2 | 11 | 1.647 | 3.176 | -1.529 | 28 | 54 | -026 | ||
| 7 | 1996/97 SHC Saturday Mixed | 4 | 1 | 3 | 1.750 | 5.250 | -3.500 | 7 | 21 | -014 | |||
| 8 | 1996 Metro 1 West Men* | 14 | 3 | 3 | 8 | 1.786 | 2.571 | -0.786 | 25 | 36 | -011 | ||
| 8 | 1996 Metro 3 West Men* | 3 | 1 | 2 | 1.333 | 2.667 | -1.333 | 4 | 8 | -004 | |||
| 5 | 1995/96 SHC Sunday Mixed | 9 | 2 | 7 | 2.667 | 6.667 | -4.000 | 24 | 60 | -036 | |||
| 10 | WS | 1995 State League 4 Men* | 2 | 1 | 1 | 1.500 | 4.000 | -2.500 | 3 | 8 | -005 | ||
| 4 | 1995 Metro 3 West Men* | 17 | 8 | 4 | 5 | 3.471 | 2.353 | +1.118 | 59 | 40 | +019 | ||
| 3 | 1995 U17 North* | 15 | 11 | 1 | 3 | 4.733 | 1.200 | +3.533 | 71 | 18 | +053 | ||
| 9 | 1994 Metro 2 West Men* | 4 | 4 | 0.500 | 6.000 | -5.500 | 2 | 24 | -022 | ||||
| 1 | 1994 U17 North* | 1 | 1 | 8.000 | 1.000 | +7.000 | 8 | 1 | +007 | ||||
| 8 | 1994 U15 Pennant* | 17 | 4 | 3 | 10 | 0.765 | 2.824 | -2.059 | 13 | 48 | -035 | ||
| 1 | PR | 1993/94 U15 Altona* | 11 | 11 | 8.364 | 0.909 | +7.455 | 92 | 10 | +082 | |||
| 5 | 1993 U15 North* | 15 | 4 | 3 | 8 | 0.867 | 2.000 | -1.133 | 13 | 30 | -017 | ||
| 2 | 1992/93 U15 Altona | 5 | 3 | 2 | 6.600 | 2.600 | +4.000 | 33 | 13 | +020 | |||
| 3 | 1992 U13 Pennant | 19 | 8 | 4 | 7 | 1.842 | 1.421 | +0.421 | 35 | 27 | +008 | ||
| 156 | 60 | 24 | 72 | 2.760 | 2.603 | +0.122 | 425 | 406 | +019 |
Goalkeeping History
| Games as Goalkeeper |
Games Won | Games Drawn | Games Lost | Total | Shut outs |
Shutout Average |
Goals Against |
G.A. Avg. |
|---|---|---|---|---|---|---|---|---|
| Junior Winter | 28 | 11 | 28 | 67 | 22 | 0.328 | 124 | 1.851 |
| Junior Summer | 14 | 0 | 2 | 16 | 5 | 0.313 | 23 | 1.438 |
| Junior Total | 42 | 11 | 30 | 83 | 27 | 0.325 | 147 | 1.771 |
| Senior Winter | 14 | 11 | 30 | 55 | 4 | 0.073 | 164 | 2.982 |
| Senior Summer | 3 | 1 | 10 | 14 | 0 | 0.000 | 83 | 5.929 |
| Total | 59 | 23 | 70 | 152 | 31 | 0.204 | 394 | 2.592 |
| Pos. | Div. | Competition | Games | Won | Drawn | Lost | Shutouts | % | Goals In | Avge. | GoalDiff |
|---|---|---|---|---|---|---|---|---|---|---|---|
| 1 | 1998/99 Footscray Tue. Men* | 1 | 1 | 0% | 2 | 2.000 | +002 | ||||
| 8 | 1997 Metro 1 West Men* | 17 | 4 | 2 | 11 | 1 | 6% | 54 | 3.176 | -026 | |
| 7 | 1996/97 SHC Saturday Mixed | 4 | 1 | 3 | 0% | 21 | 5.250 | -014 | |||
| 8 | 1996 Metro 1 West Men* | 14 | 3 | 3 | 8 | 0% | 36 | 2.571 | -011 | ||
| 8 | 1996 Metro 3 West Men* | 3 | 1 | 2 | 0% | 8 | 2.667 | -004 | |||
| 5 | 1995/96 SHC Sunday Mixed | 9 | 2 | 7 | 0% | 60 | 6.667 | -036 | |||
| 10 | 1995 State League 4 Men* | 1 | 1 | 0% | 3 | 3.000 | +000 | ||||
| 4 | 1995 Metro 3 West Men* | 16 | 7 | 4 | 5 | 3 | 19% | 39 | 2.438 | +016 | |
| 3 | 1995 U17 North* | 15 | 11 | 1 | 3 | 6 | 40% | 18 | 1.200 | +053 | |
| 9 | 1994 Metro 2 West Men* | 4 | 4 | 0% | 24 | 6.000 | -022 | ||||
| 1 | 1994 U17 North* | 1 | 1 | 0% | 1 | 1.000 | +007 | ||||
| 8 | 1994 U15 Pennant* | 17 | 4 | 3 | 10 | 4 | 24% | 48 | 2.824 | -035 | |
| 1 | 1993/94 U15 Altona* | 11 | 11 | 5 | 45% | 10 | 0.909 | +082 | |||
| 5 | 1993 U15 North* | 15 | 4 | 3 | 8 | 4 | 27% | 30 | 2.000 | -017 | |
| 2 | 1992/93 U15 Altona | 5 | 3 | 2 | 0% | 13 | 2.600 | +020 | |||
| 3 | 1992 U13 Pennant | 19 | 8 | 4 | 7 | 8 | 42% | 27 | 1.421 | +008 | |
| 152 | 59 | 23 | 70 | 31 | 20% | 394 | 2.592 | +023 |
Junior Winter Playing History
| Games as Player |
Games Won | Games Drawn | Games Lost | Total |
|---|---|---|---|---|
| Junior Winter | 28 | 11 | 28 | 67 |
| First Game : | Melton 10 def. Reservoir 0. R-01: 1992 U13 Pennant |
| Last Game : | Camberwell 3 def. Melton 2. SF: 1995 U17 North |
| Best Win : | Melton 13 def. Greensborough 0. R-18: 1995 U17 North |
| Worst Loss : | Werribee 9 def. Melton 0. R-06: 1994 U15 Pennant |
| Finals : | TEMC 7 def. Melton 1. SF: 1992 U13 Pennant Camberwell 3 def. Melton 2. SF: 1995 U17 North |
| Premierships : | None. |
Junior Summer Playing History
| Games as Player |
Games Won | Games Drawn | Games Lost | Total |
|---|---|---|---|---|
| Junior Summer | 14 | 0 | 2 | 16 |
| First Game : | Footscray 2 def. Melton 1. R-01: 1992/93 U15 Altona |
| Last Game : | Melton 0 def. ???? 0. GF: 1993/94 U15 Altona |
| Best Win : | Melton 18 def. Altona 1. R-08: 1993/94 U15 Altona |
| Worst Loss : | Footscray 5 def. Melton 3. R-04: 1992/93 U15 Altona |
| Finals : | Melton 0 def. ???? 0. GF: 1993/94 U15 Altona Melton 0 def. Altona 0. SF: 1993/94 U15 Altona |
| Premierships : | Melton 0 def. ???? 0. GF: 1993/94 U15 Altona |
Senior Winter Playing History
| Games as Player |
Games Won | Games Drawn | Games Lost | Total |
|---|---|---|---|---|
| Senior Winter | 15 | 12 | 32 | 59 |
| First Game : | Brunswick 2 def. Melton 0. R-11: 1994 Metro 2 West Men |
| Last Game : | Collegians-X 4 def. Melton 2. R-12: 1999 State League 4 Men |
| Best Win : | Melton 6 def. Mentone 0. R-17: 1995 Metro 3 West Men |
| Worst Loss : | Grail 10 def. Melton 1. R-14: 1994 Metro 2 West Men |
| Finals : | PEGS 1 def. Melton 1. SF: 1995 Metro 3 West Men |
| Premierships : | None. |
Senior Summer Playing History
| Games as Player |
Games Won | Games Drawn | Games Lost | Total |
|---|---|---|---|---|
| Senior Summer | 3 | 1 | 10 | 14 |
| First Game : | Essendon 10 def. Melton 0. R-01: 1995/96 SHC Sunday Mixed |
| Last Game : | Melton 4 def. RMIT 2. R-04: 1998/99 Footscray Tue. Men |
| Best Win : | Melton 8 def. Yarra Valley 3. R-10: 1995/96 SHC Sunday Mixed |
| Worst Loss : | RMIT 13 def. Melton 2. R-08: 1995/96 SHC Sunday Mixed |
| Finals : | None. |
| Premierships : | None. |
Teammates
Number of teammates :73
| Player |
Games |
Win % | Draw % | Loss % | Unkn % | Avge. Points |
Avge. For | Avge. Aga | Avge. Diff. |
|---|---|---|---|---|---|---|---|---|---|
| Bedggood, Stephen* | 97 | 41% | 15% | 43% | 1.392 | 2.722 | 2.082 | +0.639 | |
| Sorensen, Steven* | 74 | 34% | 18% | 49% | 1.189 | 2.014 | 2.392 | -0.378 | |
| Lawrence, Daryl* | 62 | 31% | 24% | 45% | 1.161 | 1.919 | 2.161 | -0.242 | |
| Spence, Matthew* | 61 | 56% | 16% | 28% | 1.836 | 3.246 | 1.426 | +1.820 | |
| MacKinnon, Andrew* | 57 | 53% | 11% | 37% | 1.684 | 3.825 | 1.912 | +1.912 | |
| Treganowan, Brad* | 56 | 38% | 9% | 54% | 1.214 | 2.750 | 3.250 | -0.500 | |
| Lawrence, Geoffrey* | 54 | 31% | 22% | 46% | 1.167 | 1.778 | 2.204 | -0.426 | |
| MacKinnon, Tim* | 53 | 49% | 17% | 34% | 1.642 | 3.151 | 1.906 | +1.245 | |
| Bauer, Andrew* | 52 | 50% | 13% | 37% | 1.635 | 3.327 | 1.885 | +1.442 | |
| Lake, Melissa* | 52 | 50% | 13% | 37% | 1.635 | 3.327 | 1.885 | +1.442 | |
| Treganowan, Daryn* | 51 | 45% | 14% | 41% | 1.490 | 2.392 | 1.902 | +0.490 | |
| Downs, David* | 43 | 30% | 21% | 49% | 1.116 | 2.465 | 2.977 | -0.512 | |
| Shadbolt, Narelle* | 42 | 45% | 17% | 38% | 1.524 | 2.881 | 2.000 | +0.881 | |
| Bonnici, Tania* | 42 | 43% | 14% | 43% | 1.429 | 2.786 | 2.095 | +0.690 | |
| Brown, Daniel* | 42 | 45% | 14% | 40% | 1.500 | 2.810 | 1.952 | +0.857 | |
| Granville, Alan* | 41 | 22% | 15% | 63% | 0.805 | 1.927 | 3.732 | -1.805 | |
| McNair, David* | 40 | 50% | 10% | 40% | 1.600 | 3.500 | 3.125 | +0.375 | |
| Lawrence, Glenn* | 39 | 31% | 21% | 49% | 1.128 | 2.333 | 2.897 | -0.564 | |
| Lawrence, Stephen* | 38 | 32% | 24% | 45% | 1.184 | 2.711 | 2.737 | -0.026 | |
| Kovarik, Hans* | 37 | 19% | 16% | 65% | 0.730 | 1.595 | 3.162 | -1.568 | |
| Spence, Dion* | 33 | 52% | 12% | 36% | 1.667 | 3.606 | 1.788 | +1.818 | |
| Cameron, John* | 33 | 24% | 15% | 61% | 0.879 | 1.909 | 2.788 | -0.879 | |
| Mills, Steven* | 29 | 55% | 7% | 38% | 1.724 | 4.517 | 2.759 | +1.759 | |
| Shadbolt, Ron* | 29 | 14% | 21% | 66% | 0.621 | 1.621 | 3.483 | -1.862 | |
| Powderly, Darryl* | 26 | 23% | 23% | 54% | 0.923 | 2.308 | 3.423 | -1.115 | |
| Duffy, Craig* | 25 | 28% | 8% | 64% | 0.920 | 1.960 | 3.520 | -1.560 | |
| Kari, Grant* | 25 | 56% | 8% | 36% | 1.760 | 4.200 | 2.960 | +1.240 | |
| Simpson, Matthew* | 24 | 33% | 17% | 50% | 1.167 | 1.333 | 2.250 | -0.917 | |
| Lawrence, Tony* | 24 | 38% | 21% | 42% | 1.333 | 2.917 | 2.875 | +0.042 | |
| Powderly, Phillip* | 24 | 17% | 21% | 63% | 0.708 | 2.083 | 3.333 | -1.250 | |
| Hanley-Wood, Ben* | 23 | 26% | 17% | 57% | 0.957 | 1.783 | 3.217 | -1.435 | |
| Mitchell, Sam | 22 | 59% | 14% | 27% | 1.909 | 4.500 | 1.818 | +2.682 | |
| Fraser, Darren | 19 | 42% | 21% | 37% | 1.474 | 1.842 | 1.421 | +0.421 | |
| Wordley, Paul | 18 | 39% | 22% | 39% | 1.389 | 1.722 | 1.444 | +0.278 | |
| Walton, Elliot* | 17 | 47% | 24% | 29% | 1.647 | 2.000 | 1.176 | +0.824 | |
| Bailey, Shane* | 15 | 20% | 27% | 53% | 0.867 | 1.867 | 2.600 | -0.733 | |
| Demorton, Craig | 14 | 29% | 21% | 50% | 1.071 | 0.929 | 2.071 | -1.143 | |
| Cowland, Dean* | 14 | 29% | 14% | 57% | 1.000 | 1.643 | 2.857 | -1.214 | |
| Campbell, Troy | 13 | 31% | 23% | 46% | 1.154 | 1.000 | 1.615 | -0.615 | |
| Harris, Justin | 12 | 17% | 8% | 75% | 0.583 | 1.833 | 5.917 | -4.083 | |
| McIntyre, Jamie* | 12 | 17% | 25% | 58% | 0.750 | 1.417 | 2.333 | -0.917 | |
| Irvine, Andrew* | 10 | 20% | 10% | 70% | 0.700 | 1.700 | 3.900 | -2.200 | |
| Williams, Mark* | 9 | 33% | 33% | 33% | 1.333 | 3.667 | 3.889 | -0.222 | |
| Garner, Troy | 9 | 33% | 33% | 33% | 1.333 | 3.444 | 2.444 | +1.000 | |
| Morritt, Sharon* | 9 | 22% | 78% | 0.667 | 3.222 | 6.556 | -3.333 | ||
| Martin, Michelle* | 9 | 22% | 78% | 0.667 | 2.667 | 6.667 | -4.000 | ||
| Williams, Lisa* | 9 | 22% | 78% | 0.667 | 2.667 | 6.667 | -4.000 | ||
| Bourke, Karen* | 8 | 13% | 88% | 0.375 | 2.000 | 7.125 | -5.125 | ||
| Mills, Helen* | 8 | 13% | 13% | 75% | 0.500 | 2.625 | 7.125 | -4.500 | |
| Sparks, Sarah* | 6 | 100% | 0.000 | 0.167 | 4.833 | -4.667 | |||
| Downes, Cheryl* | 6 | 17% | 83% | 0.500 | 3.167 | 7.667 | -4.500 | ||
| Lewis, Chris* | 5 | 20% | 20% | 60% | 0.800 | 2.000 | 2.800 | -0.800 | |
| Downs, Colleen* | 5 | 20% | 20% | 60% | 0.800 | 2.200 | 4.600 | -2.400 | |
| Lawrence, Richard* | 4 | 25% | 75% | 0.250 | 2.250 | 6.250 | -4.000 | ||
| McNair, Ann* | 4 | 25% | 75% | 0.250 | 1.750 | 5.250 | -3.500 | ||
| Tucker, David | 3 | 33% | 67% | 0.333 | 1.333 | 5.000 | -3.667 | ||
| Morritt, Earl* | 3 | 33% | 67% | 0.333 | 2.000 | 6.333 | -4.333 | ||
| Lawrence, William* | 2 | 100% | 0.000 | 0.500 | 8.000 | -7.500 | |||
| Treganowan, Jason | 2 | 50% | 50% | 0.500 | 1.500 | 4.000 | -2.500 | ||
| Blake, Alex* | 2 | 100% | 0.000 | 0.500 | 2.500 | -2.000 | |||
| Dooling, Matthew | 1 | 100% | 3.000 | 3.000 | 0.000 | +3.000 | |||
| Reardon, Janice* | 1 | 100% | 0.000 | 2.000 | 6.000 | -4.000 | |||
| Downes, Lana* | 1 | 100% | 3.000 | 3.000 | 2.000 | +1.000 | |||
| MacKinnon, John* | 1 | 100% | 0.000 | 1.000 | 3.000 | -2.000 | |||
| MacKinnon, Robert* | 1 | 100% | 0.000 | 1.000 | 3.000 | -2.000 | |||
| Phelan, Geraldine | 1 | 100% | 0.000 | 1.000 | 3.000 | -2.000 | |||
| Substitute, | 1 | 100% | 0.000 | 1.000 | 9.000 | -8.000 | |||
| Nothnagel, Melissa* | 1 | 100% | 1.000 | 3.000 | 3.000 | +0.000 | |||
| Steele, Lucy* | 1 | 100% | 1.000 | 3.000 | 3.000 | +0.000 | |||
| Bedggood, Melissa* | 1 | 100% | 3.000 | 4.000 | 2.000 | +2.000 | |||
| Evans, Callan | 1 | 100% | 3.000 | 4.000 | 2.000 | +2.000 | |||
| Fragopoulos, Tania* | 1 | 100% | 3.000 | 4.000 | 2.000 | +2.000 | |||
| Smakman, Luke* | 1 | 100% | 0.000 | 2.000 | 4.000 | -2.000 |
Opposition Teams
| Opponent |
Games |
Goals | Avge |
Win % | Draw % | Loss % | Unkn % | Avge. Points |
Avge. For | Avge. Aga | Avge. Diff. |
G.K. Games | Shut- outs | Shut- out % | Goals In | Goals Avge |
|---|---|---|---|---|---|---|---|---|---|---|---|---|---|---|---|---|
| Footscray | 11 | 55% | 45% | 1.636 | 3.545 | 1.727 | +1.818 | 11 | 3 | 27% | 19 | 1.727 | ||||
| Altona | 10 | 70% | 30% | 2.100 | 7.300 | 2.700 | +4.600 | 10 | 1 | 10% | 27 | 2.700 | ||||
| Werribee | 9 | 56% | 44% | 1.667 | 4.222 | 3.333 | +0.889 | 9 | 2 | 22% | 30 | 3.333 | ||||
| MUHC | 9 | 33% | 33% | 33% | 1.333 | 3.111 | 2.556 | +0.556 | 8 | 22 | 2.750 | |||||
| MCC | 8 | 50% | 13% | 38% | 1.625 | 2.000 | 2.875 | -0.875 | 8 | 1 | 13% | 23 | 2.875 | |||
| Camberwell | 8 | 25% | 25% | 50% | 1.000 | 1.625 | 1.750 | -0.125 | 8 | 1 | 13% | 14 | 1.750 | |||
| Essendon | 8 | 25% | 75% | 0.750 | 1.500 | 6.125 | -4.625 | 8 | 1 | 13% | 49 | 6.125 | ||||
| RMIT | 8 | 38% | 13% | 50% | 1.250 | 3.000 | 4.125 | -1.125 | 8 | 1 | 13% | 33 | 4.125 | |||
| Reservoir | 7 | 71% | 29% | 2.143 | 3.857 | 0.857 | +3.000 | 7 | 4 | 57% | 6 | 0.857 | ||||
| Yarra Valley | 7 | 29% | 14% | 57% | 1.000 | 1.714 | 2.143 | -0.429 | 7 | 1 | 14% | 15 | 2.143 | |||
| Kew | 7 | 43% | 43% | 14% | 1.714 | 2.143 | 0.857 | +1.286 | 7 | 3 | 43% | 6 | 0.857 | |||
| PEGS | 6 | 33% | 33% | 33% | 1.333 | 2.000 | 1.833 | +0.167 | 6 | 2 | 33% | 11 | 1.833 | |||
| TEMC | 5 | 20% | 80% | 0.600 | 0.600 | 3.400 | -2.800 | 5 | 17 | 3.400 | ||||||
| Greensborough | 5 | 80% | 20% | 2.400 | 5.400 | 0.600 | +4.800 | 5 | 3 | 60% | 3 | 0.600 | ||||
| Powerhouse | 5 | 20% | 40% | 40% | 1.000 | 1.600 | 1.800 | -0.200 | 5 | 9 | 1.800 | |||||
| Frankston | 4 | 50% | 25% | 25% | 1.750 | 2.500 | 1.000 | +1.500 | 4 | 2 | 50% | 4 | 1.000 | |||
| Croydon | 4 | 50% | 25% | 25% | 1.750 | 1.750 | 0.500 | +1.250 | 4 | 3 | 75% | 2 | 0.500 | |||
| Elsternwick | 4 | 25% | 25% | 50% | 1.000 | 0.500 | 2.500 | -2.000 | 4 | 1 | 25% | 10 | 2.500 | |||
| Brunswick | 4 | 25% | 75% | 0.750 | 2.500 | 2.500 | +0.000 | 4 | 10 | 2.500 | ||||||
| Grail | 3 | 33% | 33% | 33% | 1.333 | 3.333 | 5.667 | -2.333 | 3 | 17 | 5.667 | |||||
| Geelong | 3 | 33% | 67% | 0.333 | 1.000 | 4.667 | -3.667 | 3 | 14 | 4.667 | ||||||
| Noonans | 3 | 100% | 0.000 | 0.667 | 5.667 | -5.000 | 3 | 17 | 5.667 | |||||||
| Latrobe Uni | 3 | 33% | 67% | 0.333 | 1.333 | 2.000 | -0.667 | 3 | 6 | 2.000 | ||||||
| Doncaster | 2 | 100% | 0.000 | 0.500 | 3.000 | -2.500 | 2 | 6 | 3.000 | |||||||
| MHSOB | 2 | 50% | 50% | 0.500 | 3.500 | 4.000 | -0.500 | 2 | 8 | 4.000 | ||||||
| Mentone | 2 | 100% | 3.000 | 5.500 | 0.500 | +5.000 | 2 | 1 | 50% | 1 | 0.500 | |||||
| South Barwon | 2 | 100% | 0.000 | 1.000 | 2.500 | -1.500 | 2 | 5 | 2.500 | |||||||
| Hawthorn | 2 | 100% | 0.000 | 2.000 | 4.500 | -2.500 | 2 | 9 | 4.500 | |||||||
| ???? | 1 | 100% | 3.000 | 0.000 | 0.000 | +0.000 | 1 | 1 | 100% | 0 | 0.000 | |||||
| Box Hill | 1 | 100% | 1.000 | 1.000 | 1.000 | +0.000 | 1 | 1 | 1.000 | |||||||
| Bendigo | 1 | 100% | 0.000 | 0.000 | 5.000 | -5.000 | ||||||||||
| Old Haileybury | 1 | 100% | 1.000 | 2.000 | 2.000 | +0.000 | ||||||||||
| Collegians-X | 1 | 100% | 0.000 | 2.000 | 4.000 | -2.000 | ||||||||||
| Opponents :33 | 156 | 38% | 15% | 46% | 1.308 | 2.724 | 2.603 | +0.122 | 152 | 31 | 20% | 394 | 2.592 |
Playing Venues
| Venue | Games |
Goals | Avge. |
Win % | Draw % | Loss % | Unkn % | Avge. Points |
Avge. For | Avge. Aga | Avge. Diff. |
G.K. Games | Shut- outs | Shut- out % | Goals In | Goals Avge. |
|---|---|---|---|---|---|---|---|---|---|---|---|---|---|---|---|---|
| Altona | 42 | 64% | 5% | 31% | 1.976 | 4.643 | 2.167 | +2.476 | 41 | 9 | 22% | 86 | 2.098 | |||
| Not Recorded | 19 | 42% | 21% | 37% | 1.474 | 1.842 | 1.421 | +0.421 | 19 | 8 | 42% | 27 | 1.421 | |||
| Melton Mowbray | 18 | 33% | 28% | 39% | 1.278 | 1.667 | 2.111 | -0.444 | 17 | 36 | 2.118 | |||||
| SHC | 14 | 21% | 7% | 71% | 0.714 | 2.643 | 5.786 | -3.143 | 14 | 1 | 7% | 81 | 5.786 | |||
| Essendon | 12 | 33% | 25% | 42% | 1.250 | 1.917 | 2.333 | -0.417 | 12 | 3 | 25% | 28 | 2.333 | |||
| Footscray | 12 | 33% | 17% | 50% | 1.167 | 2.750 | 3.333 | -0.583 | 12 | 3 | 25% | 40 | 3.333 | |||
| Melton-G | 5 | 40% | 20% | 40% | 1.400 | 1.000 | 2.200 | -1.200 | 5 | 2 | 40% | 11 | 2.200 | |||
| Melbourne Uni | 4 | 50% | 25% | 25% | 1.750 | 2.750 | 2.250 | +0.500 | 3 | 8 | 2.667 | |||||
| Reservoir | 4 | 25% | 75% | 0.750 | 2.000 | 2.000 | +0.000 | 4 | 1 | 25% | 8 | 2.000 | ||||
| Olympic Park | 3 | 33% | 67% | 0.333 | 0.333 | 1.333 | -1.000 | 3 | 1 | 33% | 4 | 1.333 | ||||
| PEGS | 3 | 33% | 33% | 33% | 1.333 | 1.667 | 1.333 | +0.333 | 3 | 1 | 33% | 4 | 1.333 | |||
| Yarra Velodrome | 3 | 100% | 0.000 | 0.667 | 3.333 | -2.667 | 3 | 10 | 3.333 | |||||||
| Doncaster | 2 | 50% | 50% | 0.500 | 0.500 | 1.500 | -1.000 | 2 | 1 | 50% | 3 | 1.500 | ||||
| Geelong | 2 | 100% | 0.000 | 1.000 | 5.000 | -4.000 | 2 | 10 | 5.000 | |||||||
| Elgar Park | 2 | 50% | 50% | 0.500 | 4.500 | 5.000 | -0.500 | 2 | 10 | 5.000 | ||||||
| Monash | 2 | 50% | 50% | 1.500 | 7.500 | 2.000 | +5.500 | 1 | 1 | 100% | 0 | 0.000 | ||||
| Hawthorn | 2 | 100% | 0.000 | 2.000 | 4.500 | -2.500 | 2 | 9 | 4.500 | |||||||
| Greensborough | 1 | 100% | 0.000 | 0.000 | 1.000 | -1.000 | 1 | 1 | 1.000 | |||||||
| Dandenong | 1 | 100% | 1.000 | 1.000 | 1.000 | +0.000 | 1 | 1 | 1.000 | |||||||
| Moorabbin | 1 | 100% | 0.000 | 0.000 | 5.000 | -5.000 | 1 | 5 | 5.000 | |||||||
| Mordialloc | 1 | 100% | 3.000 | 5.000 | 1.000 | +4.000 | 1 | 1 | 1.000 | |||||||
| Camberwell | 1 | 100% | 0.000 | 2.000 | 4.000 | -2.000 | 1 | 4 | 4.000 | |||||||
| Albert Park | 1 | 100% | 0.000 | 0.000 | 2.000 | -2.000 | 1 | 2 | 2.000 | |||||||
| Melbourne High | 1 | 100% | 0.000 | 1.000 | 5.000 | -4.000 | 1 | 5 | 5.000 | |||||||
| Venues :24 | 156 | 38% | 15% | 46% | 1.308 | 2.724 | 2.603 | +0.122 | 152 | 31 | 20% | 394 | 2.592 |