 |
Melton Hockey Club |
|
Last updated : 9:32 am - 2 November 2023
Club Cap : 623
(Games : 139, Goals : 18 )
Milestones
| 2005-Apr-16 : | First game (Yarra Valley 1 def. Melton 0. R-01: 2005 U11 Pennant North) |
| 2007-May-25 : | First goal scored (Melton 5 def. Powerhouse 1. R-06: 2007 U13 Pennant North) |
| 2007-Sep-07 : | 50 Junior games (Melton 2 def. Essendon 1. SF: 2007 U13 Pennant North) |
| 2008-May-10 : | First Senior game (St.Bernards 10 def. Melton 1. R-04: 2008 Metro 3 West Men) |
| 2010-Aug-06 : | 100 Junior games (Melton 1 def. Brunswick 0. R-14: 2010 U17 West) |
| 2011-Sep-16 : | Last Junior game (PEGS 8 def. Melton 0. GF: 2011 U17 West) |
| 2012-Nov-20 : | Last game played (AHCOC 7 def. Melton 3. R-05: 2012/13 Footscray Summer) |
| Playing career : 2775 days. (7 years and 220 days.) |
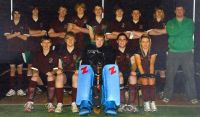
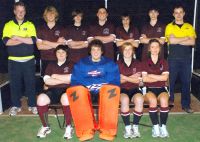
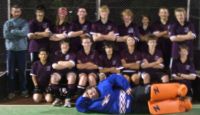
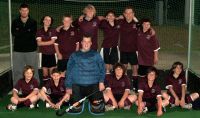
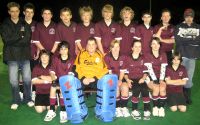
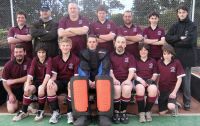
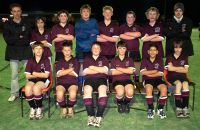
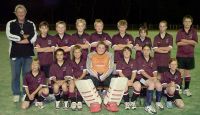
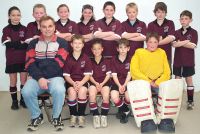
Team Photographs
Complete Playing History
Teams played with : 12
Premierships won : 1
Wooden Spoons : 1
| Games as Player |
Games Won | Games Drawn | Games Lost | Total | Goals | Goalscoring Average |
|---|---|---|---|---|---|---|
| Junior Winter | 51 | 16 | 45 | 112 | 18 | 0.164 |
| Junior Summer | 2 | 1 | 4 | 7 | 0 | 0.000 |
| Junior Total | 53 | 17 | 49 | 119 | 18 | 0.154 |
| Senior Winter | 0 | 2 | 15 | 17 | 0 | 0.000 |
| Senior Summer | 0 | 0 | 3 | 3 | 0 | 0.000 |
| Senior Total | 0 | 2 | 18 | 20 | 0 | 0.000 |
| Total | 53 | 19 | 67 | 139 | 18 | 0.131 |
| Pos. | PR/WS | Div. | Competition | Games | Goals | Avge. | Won | Drawn | Lost | Avge.For | Avge.Aga | Avge.Diff | G.For | G.Aga | GoalDiff |
|---|---|---|---|---|---|---|---|---|---|---|---|---|---|---|---|
| ? | WS | 2012/13 Footscray Summer | 3 | 3 | 1.333 | 5.667 | -4.333 | 4 | 17 | -013 | |||||
| 9 | 2012 Metro 3 West Men* | 2 | 2 | 0.500 | 7.000 | -6.500 | 1 | 14 | -013 | ||||||
| 2 | 2011 U17 West* | 14 | 2 | 0.143 | 9 | 2 | 3 | 3.143 | 1.786 | +1.357 | 44 | 25 | +019 | ||
| 7 | 2010 Metro 3 West Men* | 4 | 1 | 3 | 0.750 | 5.500 | -4.750 | 3 | 22 | -019 | |||||
| 1 | PR | 2010 U17 West* | 16 | 6 | 0.375 | 10 | 3 | 3 | 3.063 | 1.750 | +1.313 | 49 | 28 | +021 | |
| 4 | 2009 U15 West* | 16 | 3 | 0.188 | 8 | 3 | 5 | 2.813 | 1.875 | +0.938 | 45 | 30 | +015 | ||
| 6 | 2008/09 SHC-2 Under 15* | 7 | 2 | 1 | 4 | 0.857 | 2.857 | -2.000 | 6 | 20 | -014 | ||||
| 9 | 2008 Metro 3 West Men* | 11 | 1 | 10 | 0.636 | 7.364 | -6.727 | 7 | 81 | -074 | |||||
| 9 | 2008 U15 Pennant North* | 15 | 1 | 1 | 13 | 0.533 | 4.533 | -4.000 | 8 | 68 | -060 | ||||
| 2 | 2007 U13 Pennant North* | 19 | 7 | 0.368 | 13 | 3 | 3 | 3.211 | 1.211 | +2.000 | 61 | 23 | +038 | ||
| 8 | 2006 U13 Pennant North* | 18 | 3 | 2 | 13 | 1.278 | 2.778 | -1.500 | 23 | 50 | -027 | ||||
| 3 | 2005 U11 Pennant North* | 14 | 7 | 2 | 5 | 1.500 | 1.000 | +0.500 | 21 | 14 | +007 | ||||
| 139 | 18 | 0.129 | 53 | 19 | 67 | 2.000 | 2.820 | -0.863 | 272 | 392 | -120 |
Junior Winter Playing History
| Games as Player |
Games Won | Games Drawn | Games Lost | Total | Goals | Goalscoring Average |
|---|---|---|---|---|---|---|
| Junior Winter | 51 | 16 | 45 | 112 | 18 | 0.164 |
| First Game : | Yarra Valley 1 def. Melton 0. R-01: 2005 U11 Pennant North |
| Last Game : | PEGS 8 def. Melton 0. GF: 2011 U17 West |
| Best Win : | Melton 11 def. Powerhouse 0. R-15: 2007 U13 Pennant North |
| Worst Loss : | Geelong (1) 12 def. Melton 0. R-02: 2009 U15 West |
| 1 goal games : | 11 times. Last : Melton 1 drew Footscray 1. R-16: 2011 U17 West |
| 2 goal games : | 2 times. Last : Melton 7 def. Werribee 0. R-18: 2010 U17 West |
| 3 goal games : | 1 times. Last : Melton 11 def. Powerhouse 0. R-15: 2007 U13 Pennant North |
| Finals : | St.Bernards 3 def. Melton 1. GF: 2007 U13 Pennant North Melton 2 def. Essendon 1. SF: 2007 U13 Pennant North St.Bernards (1) 3 def. Melton 3. SF: 2009 U15 West Melton 5 def. Brunswick 0. GF: 2010 U17 West Melton 5 def. PEGS 0. SF: 2010 U17 West PEGS 8 def. Melton 0. GF: 2011 U17 West Melton 3 def. Footscray 0. SF: 2011 U17 West |
| Premierships : | Melton 5 def. Brunswick 0. GF: 2010 U17 West |
Junior Summer Playing History
| Games as Player |
Games Won | Games Drawn | Games Lost | Total | Goals | Goalscoring Average |
|---|---|---|---|---|---|---|
| Junior Summer | 2 | 1 | 4 | 7 | 0 | 0.000 |
| First Game : | Melton 1 def. Kew 0. R-01: 2008/09 SHC-2 Under 15 |
| Last Game : | Southern United 6 def. Melton 1. R-07: 2008/09 SHC-2 Under 15 |
| Best Win : | Melton 3 def. Southern United 1. R-02: 2008/09 SHC-2 Under 15 |
| Worst Loss : | Essendon 6 def. Melton 0. R-05: 2008/09 SHC-2 Under 15 |
| Finals : | None. |
| Premierships : | None. |
Senior Winter Playing History
| Games as Player |
Games Won | Games Drawn | Games Lost | Total | Goals | Goalscoring Average |
|---|---|---|---|---|---|---|
| Senior Winter | 0 | 2 | 15 | 17 | 0 | 0.000 |
| First Game : | St.Bernards 10 def. Melton 1. R-04: 2008 Metro 3 West Men |
| Last Game : | Werribee 6 def. Melton 1. R-17: 2012 Metro 3 West Men |
| Best Win : | Melton 1 drew Footscray 1. R-16: 2010 Metro 3 West Men |
| Worst Loss : | Powerhouse 14 def. Melton 0. R-17: 2010 Metro 3 West Men |
| Finals : | None. |
| Premierships : | None. |
Senior Summer Playing History
| Games as Player |
Games Won | Games Drawn | Games Lost | Total | Goals | Goalscoring Average |
|---|---|---|---|---|---|---|
| Senior Summer | 0 | 0 | 3 | 3 | 0 | 0.000 |
| First Game : | St.Bernards 6 def. Melton 1. R-03: 2012/13 Footscray Summer |
| Last Game : | AHCOC 7 def. Melton 3. R-05: 2012/13 Footscray Summer |
| Worst Loss : | St.Bernards 6 def. Melton 1. R-03: 2012/13 Footscray Summer |
| Finals : | None. |
| Premierships : | None. |
Teammates
Number of teammates :85
| Player |
Games |
Win % | Draw % | Loss % | Unkn % | Avge. Points |
Avge. For | Avge. Aga | Avge. Diff. |
|---|---|---|---|---|---|---|---|---|---|
| Salvatore, Aaron* | 114 | 41% | 15% | 44% | 1.386 | 2.009 | 2.281 | -0.272 | |
| McMurrie, Tom* | 114 | 38% | 14% | 48% | 1.272 | 2.079 | 2.912 | -0.833 | |
| Vallance, Liam* | 107 | 41% | 14% | 45% | 1.374 | 2.056 | 2.355 | -0.299 | |
| Kelly, Bo* | 105 | 39% | 15% | 46% | 1.324 | 2.105 | 2.857 | -0.752 | |
| Scalzo, Mark* | 92 | 46% | 14% | 40% | 1.511 | 2.380 | 2.304 | +0.076 | |
| Knipe, Jessica* | 80 | 45% | 15% | 40% | 1.500 | 2.138 | 2.150 | -0.013 | |
| Oataway, Anthony* | 78 | 38% | 14% | 47% | 1.295 | 1.923 | 2.269 | -0.346 | |
| Jackson, Taylor* | 77 | 39% | 13% | 48% | 1.299 | 1.948 | 2.416 | -0.468 | |
| Strebs-Stelps, Ben* | 62 | 58% | 15% | 27% | 1.887 | 2.677 | 1.581 | +1.097 | |
| Goss, Matthew* | 58 | 29% | 12% | 59% | 1.000 | 1.500 | 2.776 | -1.276 | |
| Kasprzak, Kathryn* | 52 | 40% | 13% | 46% | 1.346 | 1.885 | 2.308 | -0.423 | |
| VellaVanKassel, Chris* | 49 | 27% | 4% | 69% | 0.837 | 1.429 | 3.327 | -1.898 | |
| Kovarik, John* | 34 | 47% | 12% | 41% | 1.529 | 2.412 | 1.912 | +0.500 | |
| Jaros, Noah* | 33 | 33% | 9% | 58% | 1.091 | 1.636 | 3.182 | -1.545 | |
| Bluschke, Glen* | 32 | 44% | 9% | 47% | 1.406 | 2.313 | 2.094 | +0.219 | |
| Morcos, Daniel* | 30 | 60% | 20% | 20% | 2.000 | 3.067 | 1.567 | +1.500 | |
| Hardy, Jasmin* | 29 | 31% | 10% | 59% | 1.034 | 1.414 | 2.138 | -0.724 | |
| Lawrence, Jesse* | 26 | 58% | 15% | 27% | 1.885 | 3.000 | 1.808 | +1.192 | |
| Gati, Andrew* | 25 | 56% | 12% | 32% | 1.800 | 2.280 | 1.520 | +0.760 | |
| Grant-Taylor, Lexi* | 25 | 36% | 8% | 56% | 1.160 | 1.840 | 3.200 | -1.360 | |
| Kasprzak, Marcus* | 20 | 50% | 20% | 30% | 1.700 | 2.250 | 1.800 | +0.450 | |
| Carpenter, Dale* | 18 | 17% | 11% | 72% | 0.611 | 1.278 | 2.778 | -1.500 | |
| Vallance, Hayley* | 17 | 18% | 6% | 76% | 0.588 | 1.235 | 2.824 | -1.588 | |
| Vallance, Lachlan* | 17 | 59% | 18% | 24% | 1.941 | 2.706 | 1.588 | +1.118 | |
| Hobbs, Brad* | 16 | 50% | 19% | 31% | 1.688 | 2.750 | 2.313 | +0.438 | |
| Docherty, Benjamin* | 15 | 53% | 13% | 33% | 1.733 | 2.467 | 2.533 | -0.067 | |
| Corless, Sheridan* | 14 | 50% | 14% | 36% | 1.643 | 1.500 | 1.000 | +0.500 | |
| Hardy, Madeline* | 14 | 14% | 14% | 71% | 0.571 | 1.286 | 2.929 | -1.643 | |
| Eastwell, Josh* | 14 | 64% | 14% | 21% | 2.071 | 3.143 | 1.786 | +1.357 | |
| Feben, Billy* | 13 | 54% | 15% | 31% | 1.769 | 1.615 | 0.923 | +0.692 | |
| Mendez, Samuel* | 13 | 54% | 8% | 38% | 1.692 | 1.538 | 1.000 | +0.538 | |
| Woof, Thomas | 13 | 69% | 8% | 23% | 2.154 | 3.231 | 1.769 | +1.462 | |
| McMurrie, Michael* | 12 | 33% | 8% | 58% | 1.083 | 1.833 | 3.250 | -1.417 | |
| Knipe, Lucas* | 12 | 8% | 25% | 67% | 0.500 | 0.750 | 4.250 | -3.500 | |
| Shadbolt, Megan* | 12 | 67% | 17% | 17% | 2.167 | 3.250 | 1.000 | +2.250 | |
| Hobbs, Neil* | 10 | 10% | 90% | 0.100 | 0.700 | 7.700 | -7.000 | ||
| McMurrie, Andrew* | 10 | 10% | 90% | 0.100 | 0.700 | 7.700 | -7.000 | ||
| Fleming, Ashleigh* | 9 | 11% | 11% | 78% | 0.444 | 0.556 | 4.333 | -3.778 | |
| Strebs-Stelps, Leo* | 9 | 11% | 89% | 0.111 | 0.889 | 5.889 | -5.000 | ||
| Hoad, Simon* | 8 | 100% | 0.000 | 0.750 | 8.375 | -7.625 | |||
| Hooley, Ryan* | 8 | 13% | 88% | 0.125 | 0.875 | 7.500 | -6.625 | ||
| Self, Ryan* | 8 | 100% | 0.000 | 0.625 | 7.750 | -7.125 | |||
| Anderson, Matthew* | 8 | 13% | 88% | 0.125 | 0.625 | 7.000 | -6.375 | ||
| Cook, Stuart* | 8 | 13% | 88% | 0.125 | 0.500 | 4.875 | -4.375 | ||
| VellaVanKassel, Nick* | 8 | 25% | 13% | 63% | 0.875 | 1.125 | 3.125 | -2.000 | |
| Kelly, Lee* | 8 | 25% | 13% | 63% | 0.875 | 0.875 | 3.750 | -2.875 | |
| Hays, Jenna* | 7 | 43% | 14% | 43% | 1.429 | 1.429 | 1.286 | +0.143 | |
| Clough, Jarryd* | 7 | 100% | 0.000 | 1.286 | 8.143 | -6.857 | |||
| Haycock, John* | 6 | 100% | 0.000 | 0.500 | 8.667 | -8.167 | |||
| Strobel, Joshua* | 6 | 17% | 83% | 0.167 | 1.000 | 9.000 | -8.000 | ||
| Dine, Brenton* | 6 | 17% | 83% | 0.167 | 0.333 | 4.667 | -4.333 | ||
| Murphy, Craig* | 6 | 17% | 83% | 0.167 | 0.333 | 4.667 | -4.333 | ||
| Kovarik, Hans* | 6 | 17% | 83% | 0.167 | 0.667 | 6.000 | -5.333 | ||
| Bell, Ray* | 5 | 40% | 60% | 0.400 | 0.800 | 4.800 | -4.000 | ||
| Court, Andrew | 4 | 100% | 0.000 | 0.000 | 4.750 | -4.750 | |||
| Chisholm, Jack* | 4 | 25% | 75% | 0.750 | 0.750 | 5.500 | -4.750 | ||
| Corban, Malcolm* | 4 | 25% | 75% | 0.250 | 0.750 | 5.500 | -4.750 | ||
| Crebbin, Jason* | 4 | 100% | 0.000 | 1.000 | 6.250 | -5.250 | |||
| Carroll, James | 3 | 33% | 67% | 0.333 | 0.667 | 4.333 | -3.667 | ||
| Simpson, Matthew* | 3 | 100% | 0.000 | 1.000 | 7.667 | -6.667 | |||
| Mumford, Matthew* | 3 | 33% | 67% | 0.333 | 0.667 | 3.667 | -3.000 | ||
| Arnold, Andrew* | 3 | 100% | 0.000 | 1.333 | 5.667 | -4.333 | |||
| Slocombe, Morgan* | 3 | 100% | 0.000 | 1.333 | 5.667 | -4.333 | |||
| Arnold, David* | 2 | 100% | 0.000 | 0.500 | 9.000 | -8.500 | |||
| Hosking, Robert* | 2 | 100% | 0.000 | 1.000 | 3.500 | -2.500 | |||
| Moroney, Jason | 2 | 100% | 0.000 | 1.000 | 3.500 | -2.500 | |||
| Stanyer, Adrian* | 2 | 50% | 50% | 0.500 | 1.500 | 2.000 | -0.500 | ||
| Shadbolt, Ron* | 2 | 50% | 50% | 0.500 | 0.500 | 2.500 | -2.000 | ||
| May, Adrian* | 2 | 100% | 0.000 | 0.000 | 9.000 | -9.000 | |||
| Phillips, Chad* | 2 | 50% | 50% | 1.500 | 1.500 | 4.000 | -2.500 | ||
| Gray, Deane | 2 | 100% | 0.000 | 0.500 | 7.000 | -6.500 | |||
| Brazil, Sean* | 2 | 100% | 0.000 | 2.000 | 6.500 | -4.500 | |||
| Spence, Adam* | 1 | 100% | 0.000 | 1.000 | 13.000 | -12.000 | |||
| Lawrence, Daryl* | 1 | 100% | 0.000 | 2.000 | 9.000 | -7.000 | |||
| Williams, Mark* | 1 | 100% | 0.000 | 2.000 | 9.000 | -7.000 | |||
| McLaren, Scott* | 1 | 100% | 0.000 | 1.000 | 8.000 | -7.000 | |||
| Lawrence, Tony* | 1 | 100% | 0.000 | 0.000 | 13.000 | -13.000 | |||
| Downs, David* | 1 | 100% | 0.000 | 1.000 | 8.000 | -7.000 | |||
| Murphy, Mathew* | 1 | 100% | 0.000 | 2.000 | 3.000 | -1.000 | |||
| Gill, Jack | 1 | 100% | 1.000 | 1.000 | 1.000 | +0.000 | |||
| Currie, Fraser* | 1 | 100% | 3.000 | 3.000 | 0.000 | +3.000 | |||
| Arnold, Chris* | 1 | 100% | 0.000 | 0.000 | 8.000 | -8.000 | |||
| Clotworthy, Joshua* | 1 | 100% | 0.000 | 1.000 | 6.000 | -5.000 | |||
| James, Kylie-Faye* | 1 | 100% | 0.000 | 1.000 | 6.000 | -5.000 | |||
| Baker, Daniel* | 1 | 100% | 0.000 | 3.000 | 7.000 | -4.000 |
Opposition Teams
| Opponent |
Games |
Goals | Avge |
Win % | Draw % | Loss % | Unkn % | Avge. Points |
Avge. For | Avge. Aga | Avge. Diff. |
G.K. Games | Shut- outs | Shut- out % | Goals In | Goals Avge |
|---|---|---|---|---|---|---|---|---|---|---|---|---|---|---|---|---|
| Werribee | 19 | 6 | 0.316 | 53% | 11% | 37% | 1.684 | 3.526 | 2.684 | +0.842 | ||||||
| St.Bernards | 18 | 1 | 0.056 | 28% | 72% | 0.833 | 1.500 | 3.611 | -2.111 | |||||||
| Essendon | 15 | 1 | 0.067 | 53% | 7% | 40% | 1.667 | 2.067 | 2.333 | -0.267 | ||||||
| Powerhouse | 11 | 4 | 0.364 | 36% | 64% | 1.091 | 2.364 | 5.091 | -2.727 | |||||||
| Greensborough | 9 | 1 | 0.111 | 22% | 33% | 44% | 1.000 | 1.556 | 2.222 | -0.667 | ||||||
| Altona | 8 | 38% | 13% | 50% | 1.250 | 1.750 | 2.500 | -0.750 | ||||||||
| Brunswick | 8 | 63% | 38% | 1.875 | 1.750 | 2.000 | -0.250 | |||||||||
| MUHC | 7 | 14% | 29% | 57% | 0.714 | 0.857 | 1.857 | -1.000 | ||||||||
| Footscray | 7 | 2 | 0.286 | 29% | 57% | 14% | 1.429 | 1.429 | 1.714 | -0.286 | ||||||
| PEGS | 6 | 1 | 0.167 | 33% | 17% | 50% | 1.167 | 1.167 | 3.333 | -2.167 | ||||||
| Doncaster | 5 | 40% | 20% | 40% | 1.400 | 2.400 | 1.600 | +0.800 | ||||||||
| Yarra Valley | 4 | 2 | 0.500 | 50% | 25% | 25% | 1.750 | 3.000 | 0.500 | +2.500 | ||||||
| Hawthorn | 4 | 25% | 25% | 50% | 1.000 | 1.750 | 2.750 | -1.000 | ||||||||
| Geelong | 4 | 100% | 0.000 | 0.500 | 6.500 | -6.000 | ||||||||||
| TEM | 3 | 100% | 3.000 | 2.333 | 0.667 | +1.667 | ||||||||||
| Camberwell | 2 | 100% | 0.000 | 0.500 | 3.500 | -3.000 | ||||||||||
| Ajax-Maccabi | 2 | 50% | 50% | 2.000 | 2.000 | 0.000 | +2.000 | |||||||||
| RMIT | 2 | 100% | 0.000 | 1.000 | 6.500 | -5.500 | ||||||||||
| Kew | 2 | 50% | 50% | 2.000 | 1.000 | 0.500 | +0.500 | |||||||||
| Southern United | 2 | 50% | 50% | 1.500 | 2.000 | 3.500 | -1.500 | |||||||||
| AHCOC | 1 | 100% | 0.000 | 3.000 | 7.000 | -4.000 | ||||||||||
| Opponents :21 | 139 | 18 | 0.129 | 38% | 14% | 48% | 1.281 | 1.957 | 2.820 | -0.863 |
Playing Venues
| Venue | Games |
Goals | Avge. |
Win % | Draw % | Loss % | Unkn % | Avge. Points |
Avge. For | Avge. Aga | Avge. Diff. |
G.K. Games | Shut- outs | Shut- out % | Goals In | Goals Avge. |
|---|---|---|---|---|---|---|---|---|---|---|---|---|---|---|---|---|
| Melton Mowbray | 62 | 13 | 0.210 | 45% | 13% | 42% | 1.484 | 2.177 | 2.484 | -0.306 | ||||||
| SHC | 11 | 36% | 9% | 55% | 1.182 | 1.091 | 4.182 | -3.091 | ||||||||
| Werribee | 11 | 2 | 0.182 | 55% | 9% | 36% | 1.727 | 3.273 | 2.364 | +0.909 | ||||||
| Footscray | 9 | 22% | 78% | 0.667 | 1.111 | 4.444 | -3.333 | |||||||||
| Essendon | 7 | 57% | 29% | 14% | 2.000 | 2.143 | 1.000 | +1.143 | ||||||||
| St.Bernards | 7 | 1 | 0.143 | 29% | 14% | 57% | 1.000 | 1.714 | 3.286 | -1.571 | ||||||
| Melbourne Uni | 5 | 100% | 0.000 | 0.600 | 2.600 | -2.000 | ||||||||||
| Albert Park | 5 | 1 | 0.200 | 40% | 60% | 1.200 | 2.400 | 4.200 | -1.800 | |||||||
| Reservoir | 4 | 25% | 75% | 1.500 | 2.000 | 1.250 | +0.750 | |||||||||
| Brunswick | 4 | 25% | 75% | 0.750 | 1.500 | 3.500 | -2.000 | |||||||||
| PEGS | 4 | 50% | 50% | 0.500 | 0.500 | 3.500 | -3.000 | |||||||||
| Greensborough | 2 | 100% | 0.000 | 0.500 | 4.000 | -3.500 | ||||||||||
| Altona | 2 | 50% | 50% | 2.000 | 2.500 | 1.000 | +1.500 | |||||||||
| Geelong | 2 | 100% | 0.000 | 0.500 | 4.000 | -3.500 | ||||||||||
| Camberwell | 1 | 100% | 0.000 | 1.000 | 5.000 | -4.000 | ||||||||||
| Yarra Valley | 1 | 1 | 1.000 | 100% | 3.000 | 7.000 | 1.000 | +6.000 | ||||||||
| Hawthorn | 1 | 100% | 0.000 | 1.000 | 5.000 | -4.000 | ||||||||||
| Not Recorded | 1 | 100% | 3.000 | 5.000 | 0.000 | +5.000 | ||||||||||
| Venues :18 | 139 | 18 | 0.129 | 38% | 14% | 48% | 1.281 | 1.957 | 2.820 | -0.863 |