 |
Melton Hockey Club |
|
Last updated : 8:55 am - 2 November 2023
Club Cap : 742
(Games : 92, Goals : 0 )
Milestones
| 2010-Apr-16 : | First game (Geelong 12 def. Melton 0. R-01: 2010 U15 West) |
| 2011-Apr-03 : | First Senior game (Melton 4 def. St.Bernards 2. R-01: 2011 Metro 3 West Men) |
| 2012-Aug-18 : | Last Senior game (Werribee 6 def. Melton 1. R-17: 2012 Metro 3 West Men) |
| 2012-Nov-16 : | 50 Junior games (Melton 1 drew Box Hill 1. R-05: 2012/13 U17 SHC) |
| 2013-Mar-01 : | Last game played (Southern United 2 def. Melton 0. CF: 2012/13 U17 SHC) |
| Playing career : 1050 days. (2 years and 320 days.) |
Honours, Trophies, and Official Roles
| B&F Runner Up : | 2011-Metro 3 West Men |
| Captain : | 2012-U17 North/West |
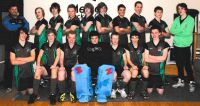
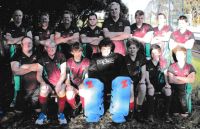
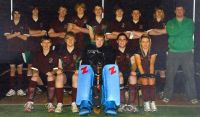
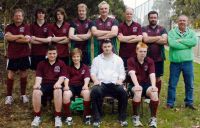
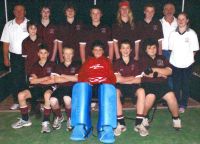
Team Photographs
Complete Playing History
Teams played with : 7
Premierships won : 0
Wooden Spoons : 0
| Games as Player |
Games Won | Games Drawn | Games Lost | Total |
|---|---|---|---|---|
| Junior Winter | 24 | 3 | 20 | 47 |
| Junior Summer | 2 | 2 | 5 | 9 |
| Junior Total | 26 | 5 | 25 | 56 |
| Senior Winter | 8 | 1 | 27 | 36 |
| Total | 34 | 6 | 52 | 92 |
| Pos. | PR/WS | Div. | Competition | Games | Won | Drawn | Lost | Avge.For | Avge.Aga | Avge.Diff | G.For | G.Aga | GoalDiff |
|---|---|---|---|---|---|---|---|---|---|---|---|---|---|
| 4 | 2012/13 U17 SHC | 9 | 2 | 2 | 5 | 1.222 | 2.111 | -0.889 | 11 | 19 | -008 | ||
| 9 | 2012 Metro 2 West Men* | 6 | 2 | 4 | 1.333 | 2.667 | -1.333 | 8 | 16 | -008 | |||
| 9 | 2012 Metro 3 West Men* | 14 | 2 | 12 | 1.286 | 5.571 | -4.286 | 18 | 78 | -060 | |||
| 3 | 2012 U17 North/West* | 12 | 8 | 4 | 3.167 | 1.583 | +1.583 | 38 | 19 | +019 | |||
| 9 | 2011 Metro 3 West Men* | 16 | 4 | 1 | 11 | 1.625 | 3.750 | -2.125 | 26 | 60 | -034 | ||
| 2 | 2011 U17 West* | 18 | 10 | 2 | 6 | 2.389 | 2.111 | +0.278 | 43 | 38 | +005 | ||
| 4 | 2010 U15 West* | 17 | 6 | 1 | 10 | 1.647 | 2.647 | -1.000 | 28 | 45 | -017 | ||
| 92 | 34 | 6 | 52 | 2.072 | 2.989 | -1.120 | 172 | 275 | -103 |
Goalkeeping History
| Games as Goalkeeper |
Games Won | Games Drawn | Games Lost | Total | Shut outs |
Shutout Average |
Goals Against |
G.A. Avg. |
|---|---|---|---|---|---|---|---|---|
| Junior Winter | 11 | 2 | 6 | 19 | 8 | 0.421 | 38 | 2.000 |
| Junior Summer | 2 | 2 | 4 | 8 | 0 | 0.000 | 17 | 2.125 |
| Junior Total | 13 | 4 | 10 | 27 | 8 | 0.296 | 55 | 2.037 |
| Senior Winter | 3 | 0 | 10 | 13 | 1 | 0.077 | 64 | 4.923 |
| Total | 16 | 4 | 20 | 40 | 9 | 0.225 | 119 | 2.975 |
| Pos. | Div. | Competition | Games | Won | Drawn | Lost | Shutouts | % | Goals In | Avge. | GoalDiff |
|---|---|---|---|---|---|---|---|---|---|---|---|
| 4 | 2012/13 U17 SHC | 8 | 2 | 2 | 4 | 0% | 17 | 2.125 | -007 | ||
| 9 | 2012 Metro 2 West Men* | 2 | 1 | 1 | 0% | 3 | 1.500 | +000 | |||
| 9 | 2012 Metro 3 West Men* | 11 | 2 | 9 | 1 | 9% | 61 | 5.545 | -044 | ||
| 3 | 2012 U17 North/West* | 1 | 1 | 1 | 100% | 0.000 | +004 | ||||
| 2 | 2011 U17 West* | 18 | 10 | 2 | 6 | 7 | 39% | 38 | 2.111 | +005 | |
| 40 | 16 | 4 | 20 | 9 | 23% | 119 | 2.975 | -042 |
Junior Winter Playing History
| Games as Player |
Games Won | Games Drawn | Games Lost | Total |
|---|---|---|---|---|
| Junior Winter | 24 | 3 | 20 | 47 |
| First Game : | Geelong 12 def. Melton 0. R-01: 2010 U15 West |
| Last Game : | Melton 2 def. Werribee 0. R-16: 2012 U17 North/West |
| Best Win : | Melton 9 def. Werribee 0. R-17: 2011 U17 West |
| Worst Loss : | Geelong 12 def. Melton 0. R-01: 2010 U15 West |
| Finals : | Essendon (R) 3 def. Melton 0. SF: 2010 U15 West PEGS 8 def. Melton 0. GF: 2011 U17 West Melton 3 def. Footscray 0. SF: 2011 U17 West |
| Premierships : | None. |
Junior Summer Playing History
| Games as Player |
Games Won | Games Drawn | Games Lost | Total |
|---|---|---|---|---|
| Junior Summer | 2 | 2 | 5 | 9 |
| First Game : | Essendon 2 def. Melton 1. R-02: 2012/13 U17 SHC |
| Last Game : | Southern United 2 def. Melton 0. CF: 2012/13 U17 SHC |
| Best Win : | Melton 3 def. Southern United 1. R-08: 2012/13 U17 SHC |
| Worst Loss : | Essendon 5 def. Melton 0. R-07: 2012/13 U17 SHC |
| Finals : | Southern United 2 def. Melton 0. CF: 2012/13 U17 SHC Essendon 2 def. Melton 1. SF: 2012/13 U17 SHC |
| Premierships : | None. |
Senior Winter Playing History
| Games as Player |
Games Won | Games Drawn | Games Lost | Total |
|---|---|---|---|---|
| Senior Winter | 8 | 1 | 27 | 36 |
| First Game : | Melton 4 def. St.Bernards 2. R-01: 2011 Metro 3 West Men |
| Last Game : | Werribee 6 def. Melton 1. R-17: 2012 Metro 3 West Men |
| Best Win : | Melton 5 def. Yarra Valley 0. R-16: 2012 Metro 3 West Men |
| Worst Loss : | Latrobe Uni 12 def. Melton 0. R-05: 2012 Metro 3 West Men |
| Finals : | None. |
| Premierships : | None. |
Teammates
Number of teammates :65
| Player |
Games |
Win % | Draw % | Loss % | Unkn % | Avge. Points |
Avge. For | Avge. Aga | Avge. Diff. |
|---|---|---|---|---|---|---|---|---|---|
| McMurrie, Michael* | 60 | 35% | 7% | 58% | 1.117 | 1.750 | 3.083 | -1.333 | |
| Strebs-Stelps, Ben* | 58 | 47% | 9% | 45% | 1.483 | 2.172 | 2.259 | -0.086 | |
| Eastwell, Josh* | 55 | 49% | 9% | 42% | 1.564 | 2.273 | 2.145 | +0.127 | |
| Chisholm, Jack* | 48 | 38% | 4% | 58% | 1.167 | 1.938 | 3.083 | -1.146 | |
| Kelly, Lee* | 47 | 40% | 6% | 53% | 1.277 | 1.787 | 2.383 | -0.596 | |
| Lawrence, Jesse* | 45 | 53% | 4% | 42% | 1.644 | 2.267 | 2.089 | +0.178 | |
| Vallance, Lachlan* | 41 | 41% | 7% | 51% | 1.317 | 2.000 | 2.171 | -0.171 | |
| Phillips, Chad* | 38 | 42% | 8% | 50% | 1.342 | 1.974 | 2.184 | -0.211 | |
| Currie, Fraser* | 33 | 48% | 6% | 45% | 1.515 | 2.273 | 2.091 | +0.182 | |
| Knipe, Lucas* | 31 | 19% | 6% | 74% | 0.645 | 1.355 | 4.452 | -3.097 | |
| Kovarik, Hans* | 30 | 20% | 3% | 77% | 0.633 | 1.467 | 4.600 | -3.133 | |
| VellaVanKassel, Nick* | 29 | 48% | 3% | 48% | 1.483 | 2.310 | 2.690 | -0.379 | |
| McMurrie, Tom* | 28 | 43% | 11% | 46% | 1.393 | 2.143 | 2.786 | -0.643 | |
| Hooley, Ryan* | 25 | 24% | 4% | 72% | 0.760 | 1.520 | 3.720 | -2.200 | |
| Simpson, Matthew* | 25 | 20% | 4% | 76% | 0.640 | 1.400 | 4.400 | -3.000 | |
| Shelly-Robbins, James* | 24 | 46% | 8% | 46% | 1.458 | 2.333 | 2.000 | +0.333 | |
| Griffiths, Rylee* | 23 | 43% | 9% | 48% | 1.391 | 2.130 | 2.217 | -0.087 | |
| Arnold, David* | 22 | 18% | 5% | 77% | 0.591 | 1.500 | 4.591 | -3.091 | |
| Haycock, John* | 20 | 20% | 5% | 75% | 0.650 | 1.350 | 3.900 | -2.550 | |
| Strebs-Stelps, Leo* | 18 | 17% | 83% | 0.500 | 1.000 | 5.278 | -4.278 | ||
| Knipe, Jessica* | 18 | 56% | 11% | 33% | 1.778 | 2.389 | 2.111 | +0.278 | |
| Lowing, Brayden* | 18 | 50% | 6% | 44% | 1.556 | 2.444 | 1.778 | +0.667 | |
| Kelly, Bo* | 17 | 53% | 12% | 35% | 1.706 | 2.471 | 2.000 | +0.471 | |
| Salvatore, Aaron* | 17 | 53% | 12% | 35% | 1.706 | 2.471 | 2.235 | +0.235 | |
| Woof, Thomas | 17 | 59% | 6% | 35% | 1.824 | 2.412 | 2.118 | +0.294 | |
| Gati, Andrew* | 16 | 56% | 6% | 38% | 1.750 | 2.500 | 2.313 | +0.188 | |
| Cook, Stuart* | 15 | 20% | 80% | 0.600 | 1.533 | 5.733 | -4.200 | ||
| Hooley, Aidan* | 15 | 53% | 13% | 33% | 1.733 | 2.467 | 2.533 | -0.067 | |
| Scalzo, Mark* | 15 | 67% | 7% | 27% | 2.067 | 2.667 | 1.867 | +0.800 | |
| Miller, Nicholas* | 14 | 21% | 7% | 71% | 0.714 | 1.429 | 4.000 | -2.571 | |
| Jackson, Taylor* | 14 | 50% | 7% | 43% | 1.571 | 2.000 | 2.643 | -0.643 | |
| Clotworthy, Joshua* | 13 | 23% | 15% | 62% | 0.846 | 1.385 | 3.615 | -2.231 | |
| Roberts, Jeremy* | 12 | 42% | 8% | 50% | 1.333 | 1.833 | 1.667 | +0.167 | |
| Gray, Deane | 10 | 10% | 90% | 0.300 | 1.000 | 5.600 | -4.600 | ||
| Lawrence, Stephen* | 9 | 33% | 11% | 56% | 1.111 | 2.333 | 3.000 | -0.667 | |
| Clough, Jarryd* | 9 | 22% | 78% | 0.667 | 1.333 | 2.889 | -1.556 | ||
| Crebbin, Jason* | 9 | 22% | 78% | 0.667 | 1.667 | 5.000 | -3.333 | ||
| Berns, Alannah* | 9 | 22% | 22% | 56% | 0.889 | 1.222 | 2.111 | -0.889 | |
| Shadbolt, Ron* | 8 | 13% | 88% | 0.375 | 1.625 | 4.875 | -3.250 | ||
| Hoad, Simon* | 8 | 13% | 88% | 0.375 | 1.375 | 3.875 | -2.500 | ||
| Self, Ryan* | 7 | 43% | 57% | 1.286 | 1.429 | 3.714 | -2.286 | ||
| Arnold, Chris* | 7 | 29% | 71% | 0.857 | 1.429 | 5.143 | -3.714 | ||
| Lawrence, Glenn* | 7 | 43% | 57% | 1.286 | 2.000 | 2.714 | -0.714 | ||
| Vallance, Liam* | 6 | 17% | 83% | 0.500 | 1.667 | 3.167 | -1.500 | ||
| Corban, Malcolm* | 6 | 33% | 67% | 1.000 | 1.167 | 2.500 | -1.333 | ||
| McLaren, Scott* | 6 | 33% | 67% | 1.000 | 1.333 | 4.667 | -3.333 | ||
| Humphrey, Hayden | 6 | 100% | 0.000 | 0.667 | 6.833 | -6.167 | |||
| Sorensen, Steven* | 6 | 33% | 67% | 1.000 | 1.333 | 2.667 | -1.333 | ||
| Logan, David | 5 | 40% | 60% | 1.200 | 2.400 | 2.600 | -0.200 | ||
| Fawcett, Tom* | 5 | 100% | 0.000 | 0.800 | 3.800 | -3.000 | |||
| Hamill, Kalon | 5 | 60% | 40% | 1.800 | 3.400 | 1.600 | +1.800 | ||
| Price, Billie* | 5 | 20% | 20% | 60% | 0.800 | 1.200 | 2.600 | -1.400 | |
| Kasprzak, Marcus* | 4 | 25% | 75% | 0.250 | 0.500 | 3.250 | -2.750 | ||
| Murphy, Mathew* | 4 | 100% | 0.000 | 1.000 | 4.750 | -3.750 | |||
| Downs, Andrew* | 3 | 33% | 67% | 1.000 | 3.000 | 3.667 | -0.667 | ||
| Lawrence, Tony* | 3 | 67% | 33% | 2.000 | 2.667 | 1.667 | +1.000 | ||
| Strobel, Joshua* | 3 | 100% | 0.000 | 0.000 | 6.667 | -6.667 | |||
| Moroney, James* | 1 | 100% | 3.000 | 4.000 | 2.000 | +2.000 | |||
| Lawrence, Geoffrey* | 1 | 100% | 0.000 | 0.000 | 3.000 | -3.000 | |||
| Hosking, Robert* | 1 | 100% | 3.000 | 5.000 | 0.000 | +5.000 | |||
| Goss, Matthew* | 1 | 100% | 0.000 | 0.000 | 7.000 | -7.000 | |||
| James, Jeff* | 1 | 100% | 0.000 | 0.000 | 4.000 | -4.000 | |||
| Grant-Taylor, Sandy* | 1 | 100% | 0.000 | 0.000 | 9.000 | -9.000 | |||
| Downs, David* | 1 | 100% | 3.000 | 5.000 | 0.000 | +5.000 | |||
| James, Kylie-Faye* | 1 | 100% | 0.000 | 1.000 | 6.000 | -5.000 |
Opposition Teams
| Opponent |
Games |
Goals | Avge |
Win % | Draw % | Loss % | Unkn % | Avge. Points |
Avge. For | Avge. Aga | Avge. Diff. |
G.K. Games | Shut- outs | Shut- out % | Goals In | Goals Avge |
|---|---|---|---|---|---|---|---|---|---|---|---|---|---|---|---|---|
| Footscray | 16 | 38% | 13% | 50% | 1.250 | 1.500 | 2.250 | -0.750 | 5 | 2 | 40% | 5 | 1.000 | |||
| Essendon | 12 | 42% | 8% | 50% | 1.333 | 1.500 | 1.667 | -0.167 | 3 | 8 | 2.667 | |||||
| Werribee | 11 | 55% | 45% | 1.636 | 3.727 | 3.273 | +0.455 | 4 | 2 | 50% | 10 | 2.500 | ||||
| Brunswick | 10 | 70% | 30% | 2.100 | 2.900 | 2.400 | +0.500 | 4 | 2 | 50% | 3 | 0.750 | ||||
| St.Bernards | 9 | 44% | 56% | 1.333 | 2.111 | 2.333 | -0.222 | 5 | 2 | 40% | 14 | 2.800 | ||||
| Altona | 6 | 33% | 67% | 1.000 | 1.500 | 1.833 | -0.333 | 2 | 3 | 1.500 | ||||||
| PEGS | 5 | 100% | 0.000 | 0.000 | 6.600 | -6.600 | 4 | 26 | 6.500 | |||||||
| MUHC | 4 | 100% | 0.000 | 0.500 | 3.750 | -3.250 | 2 | 7 | 3.500 | |||||||
| Latrobe Uni | 4 | 100% | 0.000 | 0.250 | 8.250 | -8.000 | 2 | 20 | 10.000 | |||||||
| Geelong | 3 | 100% | 0.000 | 0.000 | 8.333 | -8.333 | 1 | 9 | 9.000 | |||||||
| Yarra Valley | 3 | 33% | 33% | 33% | 1.333 | 2.667 | 1.333 | +1.333 | 1 | 1 | 100% | 0 | 0.000 | |||
| Southern United | 3 | 33% | 67% | 1.000 | 1.667 | 2.333 | -0.667 | 3 | 7 | 2.333 | ||||||
| RMIT | 2 | 50% | 50% | 1.500 | 3.500 | 1.500 | +2.000 | |||||||||
| Greensborough | 2 | 50% | 50% | 1.500 | 3.500 | 2.500 | +1.000 | 2 | 5 | 2.500 | ||||||
| Box Hill | 2 | 100% | 1.000 | 1.000 | 1.000 | +0.000 | 2 | 2 | 1.000 | |||||||
| Opponents :15 | 92 | 37% | 7% | 57% | 1.174 | 1.870 | 2.989 | -1.120 | 40 | 9 | 23% | 119 | 2.975 |
Playing Venues
| Venue | Games |
Goals | Avge. |
Win % | Draw % | Loss % | Unkn % | Avge. Points |
Avge. For | Avge. Aga | Avge. Diff. |
G.K. Games | Shut- outs | Shut- out % | Goals In | Goals Avge. |
|---|---|---|---|---|---|---|---|---|---|---|---|---|---|---|---|---|
| Melton Mowbray | 38 | 47% | 5% | 47% | 1.474 | 2.105 | 2.868 | -0.763 | 14 | 3 | 21% | 43 | 3.071 | |||
| Footscray | 11 | 27% | 73% | 0.818 | 1.455 | 3.273 | -1.818 | 2 | 10 | 5.000 | ||||||
| SHC | 11 | 18% | 18% | 64% | 0.727 | 1.000 | 3.182 | -2.182 | 9 | 24 | 2.667 | |||||
| Werribee | 7 | 57% | 43% | 1.714 | 4.000 | 2.857 | +1.143 | 3 | 3 | 100% | 0 | 0.000 | ||||
| Essendon | 6 | 33% | 67% | 1.000 | 1.833 | 2.167 | -0.333 | 1 | 5 | 5.000 | ||||||
| Brunswick | 5 | 80% | 20% | 2.400 | 2.200 | 1.200 | +1.000 | 3 | 2 | 67% | 1 | 0.333 | ||||
| Altona | 4 | 100% | 0.000 | 1.000 | 2.500 | -1.500 | 1 | 2 | 2.000 | |||||||
| PEGS | 3 | 33% | 67% | 0.333 | 0.667 | 5.333 | -4.667 | 2 | 9 | 4.500 | ||||||
| Melbourne Uni | 2 | 100% | 0.000 | 0.000 | 2.000 | -2.000 | 1 | 2 | 2.000 | |||||||
| Yarra Valley | 1 | 100% | 1.000 | 3.000 | 3.000 | +0.000 | ||||||||||
| St.Bernards | 1 | 100% | 3.000 | 5.000 | 0.000 | +5.000 | 1 | 1 | 100% | 0 | 0.000 | |||||
| Reservoir | 1 | 100% | 0.000 | 0.000 | 12.000 | -12.000 | 1 | 12 | 12.000 | |||||||
| Geelong | 1 | 100% | 0.000 | 0.000 | 9.000 | -9.000 | 1 | 9 | 9.000 | |||||||
| Greensborough | 1 | 100% | 0.000 | 1.000 | 2.000 | -1.000 | 1 | 2 | 2.000 | |||||||
| Venues :14 | 92 | 37% | 7% | 57% | 1.174 | 1.870 | 2.989 | -1.120 | 40 | 9 | 23% | 119 | 2.975 |