 |
Melton Hockey Club |
|
Last updated : 5:44 am - 26 November 2023
Club Cap : 530
(Games : 185, Goals : 44 )
First XI Men's Cap : 139
(Games : 40, Goals : 1)
Milestones
| 2002-Apr-20 : | First Junior game (Melton 4 def. Altona 0. R-01: 2002 U11 Pennant North) |
| 2002-Apr-20 : | First game (Melton 4 def. Altona 0. R-01: 2002 U11 Pennant North) |
| 2002-May-11 : | First goal scored (Melton 2 def. Werribee 0. R-04: 2002 U11 Pennant North) |
| 2004-Aug-13 : | 50 Junior games (Melton 6 def. Altona 0. R-16: 2004 U13 North) |
| 2006-Aug-04 : | 100 Junior games (Melton 4 def. Box Hill 1. R-14: 2006 U17 North) |
| 2007-Apr-29 : | First Senior game (Melton 10 def. MUHC 1. R-02: 2007 Metro 3 West Men) |
| 2007-Jun-22 : | Last Junior game (Doncaster 3 def. Melton 2. R-09: 2007 U15 North) |
| 2009-Apr-26 : | First Senior goal (Melton 5 def. Brunswick 2. R-02: 2009 Metro 2 West Men) |
| 2011-Apr-10 : | First First XI Mens game (Melton 2 def. Bayside 0. R-02: 2011 State League 5 Men) |
| 2014-Aug-30 : | Last First XI Mens game played (Melton 6 def. RMIT 1. R-18: 2014 Vic League 3 Men) |
| 2015-Jun-27 : | Last Senior game (Melton 6 def. PEGS 0. R-10: 2015 Metro B North/West Men) |
| 2015-Jun-27 : | Last game played (Melton 6 def. PEGS 0. R-10: 2015 Metro B North/West Men) |
| Playing career : 4816 days. (13 years and 71 days.) |
Honours, Trophies, and Official Roles
| Coach's Award : | 2006-U17 North |
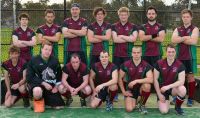
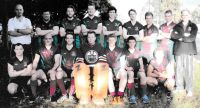
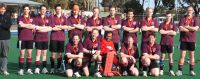
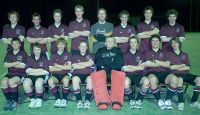
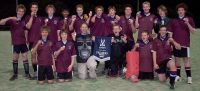
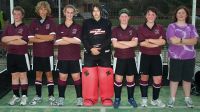
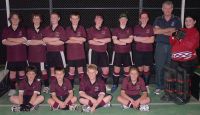
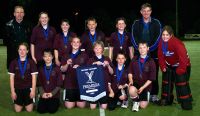
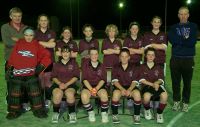
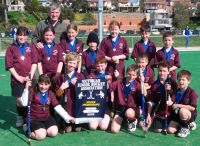
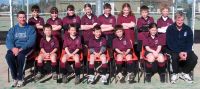
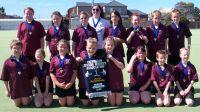
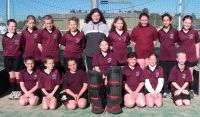
Team Photographs
Complete Playing History
Teams played with : 20
Premierships won : 4
Wooden Spoons : 1
| Games as Player |
Games Won | Games Drawn | Games Lost | Total | Goals | Goalscoring Average |
|---|---|---|---|---|---|---|
| Junior Winter | 69 | 11 | 11 | 91 | 29 | 0.322 |
| Junior Summer | 6 | 0 | 11 | 17 | 13 | 0.765 |
| Junior Total | 75 | 11 | 22 | 108 | 42 | 0.393 |
| Senior Winter | 31 | 13 | 33 | 77 | 2 | 0.026 |
| Total | 106 | 24 | 55 | 185 | 44 | 0.239 |
| Pos. | PR/WS | Div. | Competition | Games | Goals | Avge. | Won | Drawn | Lost | Avge.For | Avge.Aga | Avge.Diff | G.For | G.Aga | GoalDiff |
|---|---|---|---|---|---|---|---|---|---|---|---|---|---|---|---|
| 2 | 2015 Metro B North/West Men* | 1 | 1 | 6.000 | 0.000 | +6.000 | 6 | 0 | +006 | ||||||
| 7 | 2014 Vic League 3 Men* | 12 | 3 | 1 | 8 | 2.000 | 3.250 | -1.250 | 24 | 39 | -015 | ||||
| 3 | 2014 Vic League 3 Res. Men* | 3 | 1 | 2 | 2.333 | 3.000 | -0.667 | 7 | 9 | -002 | |||||
| 8 | 2012 State League 4 Men* | 15 | 1 | 0.067 | 2 | 3 | 10 | 1.533 | 3.067 | -1.533 | 23 | 46 | -023 | ||
| 9 | 2012 Metro 2 West Men* | 2 | 2 | 1.000 | 2.000 | -1.000 | 2 | 4 | -002 | ||||||
| 9 | 2012 Metro 3 West Men* | 1 | 1 | 0.000 | 1.000 | -1.000 | 0 | 1 | -001 | ||||||
| 3 | 2011 State League 5 Men* | 13 | 7 | 3 | 3 | 2.231 | 1.308 | +0.923 | 29 | 17 | +012 | ||||
| 3 | 2011 Metro 2 West Men* | 5 | 3 | 1 | 1 | 3.400 | 2.200 | +1.200 | 17 | 11 | +006 | ||||
| 2 | 2009 Metro 2 West Men* | 19 | 1 | 0.053 | 13 | 3 | 3 | 4.316 | 1.632 | +2.684 | 82 | 31 | +051 | ||
| 5 | 2007 Metro 3 West Men* | 6 | 1 | 2 | 3 | 3.500 | 4.000 | -0.500 | 21 | 24 | -003 | ||||
| 8 | 2007 U15 North* | 2 | 2 | 1.000 | 3.000 | -2.000 | 2 | 6 | -004 | ||||||
| 1 | PR | 2006 U17 North* | 17 | 12 | 3 | 2 | 2.529 | 0.765 | +1.765 | 43 | 13 | +030 | |||
| 5 | 2005/06 U15 Essendon Friday* | 10 | 12 | 1.200 | 4 | 6 | 3.300 | 3.200 | +0.100 | 33 | 32 | +001 | |||
| 8 | WS | 2005 U17 North* | 1 | 1 | 0.000 | 4.000 | -4.000 | 0 | 4 | -004 | |||||
| 2 | 2005 U13 North* | 17 | 10 | 0.588 | 13 | 4 | 3.706 | 1.176 | +2.529 | 63 | 20 | +043 | |||
| 5 | 2004/05 U13 Essendon Friday | 7 | 1 | 0.143 | 2 | 5 | 2.857 | 3.857 | -1.000 | 20 | 27 | -007 | |||
| 1 | PR | 2004 U13 North* | 16 | 7 | 0.438 | 12 | 3 | 1 | 2.625 | 0.625 | +2.000 | 42 | 10 | +032 | |
| 2 | 2003 U13 North* | 1 | 1 | 1.000 | 0.000 | +1.000 | 1 | 0 | +001 | ||||||
| 1 | PR | 2003 U11 North* | 18 | 9 | 0.500 | 16 | 2 | 3.333 | 0.278 | +3.056 | 60 | 5 | +055 | ||
| 1 | PR | 2002 U11 Pennant North* | 19 | 3 | 0.158 | 15 | 3 | 1 | 2.947 | 0.368 | +2.579 | 56 | 7 | +049 | |
| 185 | 44 | 0.238 | 106 | 24 | 55 | 2.886 | 1.654 | +1.216 | 531 | 306 | +225 |
Junior Winter Playing History
| Games as Player |
Games Won | Games Drawn | Games Lost | Total | Goals | Goalscoring Average |
|---|---|---|---|---|---|---|
| Junior Winter | 69 | 11 | 11 | 91 | 29 | 0.322 |
| First Game : | Melton 4 def. Altona 0. R-01: 2002 U11 Pennant North |
| Last Game : | Doncaster 3 def. Melton 2. R-09: 2007 U15 North |
| Best Win : | Melton 11 def. Camberwell 0. R-07: 2003 U11 North |
| Worst Loss : | St.Bernards 4 def. Melton 0. R-07: 2006 U17 North |
| 1 goal games : | 15 times. Last : Greensborough 3 def. Melton 2. R-13: 2005 U13 North |
| 2 goal games : | 5 times. Last : Melton 5 def. Powerhouse 1. R-17: 2005 U13 North |
| 4 goal games : | 1 times. Last : Melton 11 def. Camberwell 0. R-07: 2003 U11 North |
| Finals : | Melton 0 drew Powerhouse 0. GF: 2002 U11 Pennant North Melton 2 def. Brunswick 1. SF: 2002 U11 Pennant North Melton 2 def. Yarra Valley 1. GF: 2003 U11 North Melton 3 def. Hawthorn 0. SF: 2003 U11 North Melton 1 def. Box Hill 0. GF: 2004 U13 North Melton 2 def. Hawthorn 2. SF: 2004 U13 North Greensborough 4 def. Melton 0. GF: 2005 U13 North Melton 0 def. Yarra Valley 0. SF: 2005 U13 North Melton 1 def. St.Bernards 0. GF: 2006 U17 North Melton 4 def. Hawthorn 1. SF: 2006 U17 North |
| Premierships : | Melton 0 drew Powerhouse 0. GF: 2002 U11 Pennant North Melton 2 def. Yarra Valley 1. GF: 2003 U11 North Melton 1 def. Box Hill 0. GF: 2004 U13 North Melton 1 def. St.Bernards 0. GF: 2006 U17 North |
Junior Summer Playing History
| Games as Player |
Games Won | Games Drawn | Games Lost | Total | Goals | Goalscoring Average |
|---|---|---|---|---|---|---|
| Junior Summer | 6 | 0 | 11 | 17 | 13 | 0.765 |
| First Game : | Essendon (G) 8 def. Melton 4. R-01: 2004/05 U13 Essendon Friday |
| Last Game : | Melton 5 def. Footscray (B) 4. R-10: 2005/06 U15 Essendon Friday |
| Best Win : | Melton 7 def. Werribee 0. R-08: 2004/05 U13 Essendon Friday |
| Worst Loss : | Essendon (B) 7 def. Melton 1. R-06: 2004/05 U13 Essendon Friday |
| 1 goal games : | 8 times. Last : Melton 5 def. Footscray (B) 4. R-10: 2005/06 U15 Essendon Friday |
| 2 goal games : | 1 times. Last : Essendon (H) 4 def. Melton 3. R-03: 2005/06 U15 Essendon Friday |
| 3 goal games : | 1 times. Last : Melton 6 def. Lowther Hall 1. R-01: 2005/06 U15 Essendon Friday |
| Finals : | None. |
| Premierships : | None. |
Senior Winter Playing History
| Games as Player |
Games Won | Games Drawn | Games Lost | Total | Goals | Goalscoring Average |
|---|---|---|---|---|---|---|
| Senior Winter | 31 | 13 | 33 | 77 | 2 | 0.026 |
| First Game : | Melton 10 def. MUHC 1. R-02: 2007 Metro 3 West Men |
| Last Game : | Melton 6 def. PEGS 0. R-10: 2015 Metro B North/West Men |
| Best Win : | Melton 14 def. Latrobe Uni 0. R-08: 2009 Metro 2 West Men |
| Worst Loss : | Yarra Valley 10 def. Melton 1. R-12: 2007 Metro 3 West Men |
| 1 goal games : | 2 times. Last : Melton 3 def. Old Haileybury 2. R-08: 2012 State League 4 Men |
| Finals : | Footscray 4 def. Melton 2. GF: 2009 Metro 2 West Men Melton 4 def. PEGS 0. PF: 2009 Metro 2 West Men Footscray 4 def. Melton 2. SF: 2009 Metro 2 West Men Old Melburnians 2 def. Melton 1. PF: 2011 State League 5 Men Old Haileybury 4 def. Melton 2. QF: 2011 State League 5 Men |
| Premierships : | None. |
Teammates
Number of teammates :123
| Player |
Games |
Win % | Draw % | Loss % | Unkn % | Avge. Points |
Avge. For | Avge. Aga | Avge. Diff. |
|---|---|---|---|---|---|---|---|---|---|
| Baker, Daniel* | 87 | 53% | 13% | 34% | 1.713 | 2.460 | 1.724 | +0.736 | |
| Chisholm, Rebecca* | 87 | 71% | 9% | 20% | 2.230 | 3.149 | 1.161 | +1.989 | |
| Buttigieg, Stephanie* | 85 | 72% | 8% | 20% | 2.235 | 3.106 | 1.176 | +1.929 | |
| Shadbolt, Megan* | 58 | 74% | 9% | 17% | 2.310 | 3.190 | 1.069 | +2.121 | |
| McMurrie, Andrew* | 53 | 70% | 11% | 19% | 2.208 | 2.849 | 1.113 | +1.736 | |
| Parker, Liam* | 51 | 73% | 10% | 18% | 2.275 | 3.294 | 1.059 | +2.235 | |
| McCann, Matthew* | 50 | 80% | 16% | 4% | 2.560 | 2.820 | 0.400 | +2.420 | |
| Kelly, Bo* | 50 | 48% | 10% | 42% | 1.540 | 2.880 | 2.360 | +0.520 | |
| Kovarik, John* | 49 | 71% | 6% | 22% | 2.204 | 3.367 | 1.286 | +2.082 | |
| Johnston, Catrina* | 48 | 79% | 10% | 10% | 2.479 | 3.104 | 0.667 | +2.438 | |
| Clough, Jarryd* | 46 | 57% | 17% | 26% | 1.870 | 3.283 | 1.696 | +1.587 | |
| Noonan, Kristian* | 46 | 46% | 17% | 37% | 1.543 | 2.174 | 1.783 | +0.391 | |
| Hosking, Michael* | 44 | 55% | 14% | 32% | 1.773 | 2.545 | 1.659 | +0.886 | |
| Slocombe, Morgan* | 44 | 45% | 23% | 32% | 1.591 | 2.864 | 1.932 | +0.932 | |
| Self, Ryan* | 43 | 30% | 16% | 53% | 1.070 | 1.977 | 2.535 | -0.558 | |
| Mumford, Matthew* | 42 | 43% | 24% | 33% | 1.524 | 2.048 | 1.833 | +0.214 | |
| Holahan, Zac* | 38 | 58% | 16% | 26% | 1.895 | 3.421 | 1.684 | +1.737 | |
| Arnold, Andrew* | 38 | 29% | 18% | 53% | 1.053 | 1.816 | 2.447 | -0.632 | |
| Jennings, Nathan* | 35 | 86% | 14% | 2.714 | 2.971 | 0.229 | +2.743 | ||
| Bluschke, Glen* | 35 | 83% | 6% | 11% | 2.543 | 3.514 | 0.714 | +2.800 | |
| Downs, Cassandra* | 34 | 62% | 9% | 29% | 1.941 | 2.824 | 1.500 | +1.324 | |
| Sorensen, Steven* | 33 | 52% | 18% | 30% | 1.727 | 2.970 | 1.636 | +1.333 | |
| Lawrence, Daryl* | 31 | 58% | 19% | 23% | 1.935 | 3.806 | 2.032 | +1.774 | |
| Hanley-Wood, Ben* | 29 | 31% | 21% | 48% | 1.138 | 1.828 | 2.414 | -0.586 | |
| Arnold, Chris* | 28 | 57% | 18% | 25% | 1.893 | 3.750 | 1.679 | +2.071 | |
| Purdie, Samantha* | 27 | 74% | 19% | 7% | 2.407 | 2.296 | 0.593 | +1.704 | |
| Downs, Andrew* | 27 | 70% | 15% | 15% | 2.259 | 2.815 | 1.000 | +1.815 | |
| Strobel, Joshua* | 26 | 62% | 19% | 19% | 2.038 | 4.077 | 2.038 | +2.038 | |
| Strebs-Stelps, Ben* | 26 | 27% | 12% | 62% | 0.923 | 2.077 | 3.000 | -0.923 | |
| Lightley, Pamela* | 25 | 64% | 12% | 24% | 2.040 | 2.640 | 1.400 | +1.240 | |
| Crebbin, Jason* | 25 | 20% | 12% | 68% | 0.720 | 1.840 | 3.200 | -1.360 | |
| Grant-Taylor, Lexi* | 23 | 57% | 43% | 1.696 | 3.217 | 2.130 | +1.087 | ||
| Spence, Adam* | 23 | 52% | 22% | 26% | 1.783 | 2.652 | 1.783 | +0.870 | |
| VellaVanKassel, Chris* | 21 | 24% | 19% | 57% | 0.905 | 1.905 | 2.810 | -0.905 | |
| McLaren, Scott* | 20 | 35% | 20% | 45% | 1.250 | 2.500 | 2.450 | +0.050 | |
| Lawrence, Richard* | 20 | 15% | 20% | 65% | 0.650 | 1.450 | 2.850 | -1.400 | |
| Begg, Catherine* | 19 | 79% | 16% | 5% | 2.526 | 2.842 | 0.316 | +2.526 | |
| Matthews, Ben* | 19 | 63% | 16% | 21% | 2.053 | 2.526 | 1.368 | +1.158 | |
| Downs, David* | 19 | 68% | 16% | 16% | 2.211 | 4.421 | 1.684 | +2.737 | |
| Noble, Carl* | 18 | 78% | 17% | 6% | 2.500 | 2.889 | 0.444 | +2.444 | |
| Johnson, Shaun* | 18 | 67% | 17% | 17% | 2.167 | 2.389 | 0.944 | +1.444 | |
| McMurrie, Tom* | 18 | 72% | 28% | 2.167 | 3.556 | 1.222 | +2.333 | ||
| Thomas, Joshua* | 18 | 67% | 17% | 17% | 2.167 | 4.333 | 1.667 | +2.667 | |
| Graetz, Ashley* | 17 | 76% | 18% | 6% | 2.471 | 2.941 | 0.412 | +2.529 | |
| Graetz, Chris* | 17 | 76% | 18% | 6% | 2.471 | 2.941 | 0.412 | +2.529 | |
| Purdie, Kate* | 17 | 88% | 12% | 2.765 | 3.353 | 0.294 | +3.059 | ||
| Hocking, Branton* | 17 | 65% | 18% | 18% | 2.118 | 2.294 | 0.941 | +1.353 | |
| Thomas, Callan* | 16 | 88% | 13% | 2.750 | 3.438 | 0.313 | +3.125 | ||
| Coe, Nathan* | 16 | 94% | 6% | 2.875 | 3.438 | 0.188 | +3.250 | ||
| Bonney, Michael* | 16 | 69% | 19% | 13% | 2.250 | 2.500 | 0.813 | +1.688 | |
| Hooley, Ryan* | 16 | 63% | 19% | 19% | 2.063 | 2.500 | 0.938 | +1.563 | |
| O`Meara, Jessica* | 15 | 73% | 20% | 7% | 2.400 | 2.800 | 0.467 | +2.333 | |
| Blobell, Jaden* | 15 | 87% | 13% | 2.733 | 2.600 | 0.333 | +2.267 | ||
| Montalto, Gavin* | 15 | 80% | 13% | 7% | 2.533 | 2.733 | 0.600 | +2.133 | |
| Greed, Justin* | 15 | 73% | 7% | 20% | 2.267 | 4.467 | 1.733 | +2.733 | |
| Rodrigues, Errol* | 14 | 64% | 21% | 14% | 2.143 | 3.571 | 1.714 | +1.857 | |
| Kelly, Lee* | 14 | 21% | 21% | 57% | 0.857 | 1.929 | 3.143 | -1.214 | |
| Corban, Malcolm* | 13 | 46% | 15% | 38% | 1.538 | 2.692 | 1.846 | +0.846 | |
| Tannenberg, Luke | 13 | 54% | 23% | 23% | 1.846 | 2.231 | 1.308 | +0.923 | |
| Knipe, Lucas* | 12 | 33% | 67% | 1.000 | 1.417 | 2.583 | -1.167 | ||
| May, Adrian* | 12 | 25% | 8% | 67% | 0.833 | 2.083 | 3.500 | -1.417 | |
| Brazil, Sean* | 12 | 25% | 8% | 67% | 0.833 | 2.167 | 3.083 | -0.917 | |
| Lang, Joshua* | 11 | 82% | 18% | 2.636 | 2.727 | 0.455 | +2.273 | ||
| Eastwell, Josh* | 11 | 18% | 9% | 73% | 0.636 | 2.000 | 3.727 | -1.727 | |
| Haycock, John* | 10 | 10% | 20% | 70% | 0.500 | 2.300 | 3.300 | -1.000 | |
| McMurrie, Michael* | 10 | 30% | 70% | 0.900 | 1.500 | 2.500 | -1.000 | ||
| Hogg, Megan* | 9 | 78% | 22% | 2.556 | 2.000 | 0.222 | +1.778 | ||
| Bennett, Graeme* | 9 | 44% | 22% | 33% | 1.556 | 3.556 | 3.333 | +0.222 | |
| Lawrence, Stephen* | 9 | 44% | 11% | 44% | 1.444 | 2.778 | 2.667 | +0.111 | |
| Rapaic, Tanya* | 7 | 71% | 29% | 2.429 | 2.143 | 0.286 | +1.857 | ||
| Lawrence, Glenn* | 7 | 43% | 14% | 43% | 1.429 | 2.714 | 2.143 | +0.571 | |
| Darcy, Astin* | 6 | 17% | 33% | 50% | 0.833 | 3.500 | 4.000 | -0.500 | |
| Bluschke, Alf* | 6 | 67% | 17% | 17% | 2.167 | 3.333 | 2.000 | +1.333 | |
| Vallance, Lachlan* | 6 | 33% | 17% | 50% | 1.167 | 2.167 | 2.333 | -0.167 | |
| Spence, Dion* | 5 | 20% | 20% | 60% | 0.800 | 3.600 | 4.200 | -0.600 | |
| Lawrence, Geoffrey* | 5 | 60% | 20% | 20% | 2.000 | 3.400 | 2.200 | +1.200 | |
| Salvatore, Aaron* | 5 | 60% | 40% | 1.800 | 2.600 | 2.200 | +0.400 | ||
| Gilham, Rachel | 4 | 100% | 0.000 | 1.500 | 5.000 | -3.500 | |||
| Gilham, Shannen | 4 | 100% | 0.000 | 1.500 | 5.000 | -3.500 | |||
| Arnold, David* | 4 | 25% | 25% | 50% | 1.000 | 4.000 | 5.250 | -1.250 | |
| Cook, Stuart* | 4 | 25% | 75% | 0.750 | 4.000 | 1.750 | +2.250 | ||
| Buttigieg, William* | 3 | 33% | 67% | 0.333 | 1.000 | 3.000 | -2.000 | ||
| Agius, Jesse* | 3 | 33% | 33% | 33% | 1.333 | 1.667 | 1.333 | +0.333 | |
| Hoad, Simon* | 3 | 33% | 67% | 1.667 | 5.333 | 2.333 | +3.000 | ||
| Lawrence, Tony* | 3 | 33% | 67% | 1.000 | 3.333 | 3.000 | +0.333 | ||
| Murphy, Mathew* | 3 | 67% | 33% | 2.333 | 4.333 | 1.000 | +3.333 | ||
| Strebs-Stelps, Leo* | 3 | 33% | 33% | 33% | 1.333 | 2.667 | 1.000 | +1.667 | |
| Simpson, Matthew* | 3 | 67% | 33% | 2.000 | 4.333 | 0.333 | +4.000 | ||
| Shelly-Robbins, James* | 3 | 33% | 67% | 1.000 | 1.667 | 2.667 | -1.000 | ||
| Lawrence, Jesse* | 3 | 33% | 67% | 1.000 | 2.333 | 3.000 | -0.667 | ||
| Cameron, John* | 2 | 50% | 50% | 0.500 | 1.500 | 2.500 | -1.000 | ||
| Fleming, Ashleigh* | 2 | 100% | 0.000 | 1.000 | 3.000 | -2.000 | |||
| Goss, Matthew* | 2 | 100% | 0.000 | 1.000 | 3.000 | -2.000 | |||
| Jackson, Taylor* | 2 | 100% | 0.000 | 1.000 | 3.000 | -2.000 | |||
| Kasprzak, Kathryn* | 2 | 100% | 0.000 | 1.000 | 3.000 | -2.000 | |||
| Knipe, Jessica* | 2 | 100% | 0.000 | 1.000 | 3.000 | -2.000 | |||
| Medley, Corey* | 2 | 100% | 0.000 | 1.000 | 3.000 | -2.000 | |||
| Shadbolt, Ron* | 2 | 50% | 50% | 1.500 | 2.000 | 4.000 | -2.000 | ||
| VellaVanKassel, Nick* | 2 | 50% | 50% | 1.500 | 3.000 | 3.000 | +0.000 | ||
| Gorton, David* | 2 | 50% | 50% | 1.500 | 3.000 | 1.000 | +2.000 | ||
| Robertson, Rachel* | 1 | 100% | 3.000 | 1.000 | 0.000 | +1.000 | |||
| Bluschke, Mark* | 1 | 100% | 0.000 | 4.000 | 5.000 | -1.000 | |||
| Kasprzak, Marcus* | 1 | 100% | 0.000 | 0.000 | 3.000 | -3.000 | |||
| Medley, Daniel* | 1 | 100% | 0.000 | 0.000 | 3.000 | -3.000 | |||
| Hays, Jenna* | 1 | 100% | 0.000 | 2.000 | 3.000 | -1.000 | |||
| Powderly, Joshua* | 1 | 100% | 0.000 | 2.000 | 3.000 | -1.000 | |||
| Anderson, Matthew* | 1 | 100% | 3.000 | 4.000 | 1.000 | +3.000 | |||
| Stanyer, Adrian* | 1 | 100% | 3.000 | 4.000 | 1.000 | +3.000 | |||
| Lawrence, William* | 1 | 100% | 3.000 | 8.000 | 1.000 | +7.000 | |||
| Vallance, Liam* | 1 | 100% | 3.000 | 8.000 | 1.000 | +7.000 | |||
| Clotworthy, Joshua* | 1 | 100% | 0.000 | 0.000 | 1.000 | -1.000 | |||
| Fawcett, Tom* | 1 | 100% | 0.000 | 0.000 | 1.000 | -1.000 | |||
| Humphrey, Hayden | 1 | 100% | 0.000 | 0.000 | 1.000 | -1.000 | |||
| Kovarik, Hans* | 1 | 100% | 0.000 | 0.000 | 1.000 | -1.000 | |||
| Currie, Fraser* | 1 | 100% | 0.000 | 1.000 | 7.000 | -6.000 | |||
| Griffiths, Rylee* | 1 | 100% | 3.000 | 5.000 | 0.000 | +5.000 | |||
| McMillan, Brent* | 1 | 100% | 3.000 | 5.000 | 0.000 | +5.000 | |||
| Baxter, Peter* | 1 | 100% | 3.000 | 6.000 | 0.000 | +6.000 | |||
| Galea, John* | 1 | 100% | 3.000 | 6.000 | 0.000 | +6.000 | |||
| James, Daniel* | 1 | 100% | 3.000 | 6.000 | 0.000 | +6.000 | |||
| James, Jeff* | 1 | 100% | 3.000 | 6.000 | 0.000 | +6.000 | |||
| James, William* | 1 | 100% | 3.000 | 6.000 | 0.000 | +6.000 | |||
| Nurse, Cameron* | 1 | 100% | 3.000 | 6.000 | 0.000 | +6.000 |
Opposition Teams
| Opponent |
Games |
Goals | Avge |
Win % | Draw % | Loss % | Unkn % | Avge. Points |
Avge. For | Avge. Aga | Avge. Diff. |
G.K. Games | Shut- outs | Shut- out % | Goals In | Goals Avge |
|---|---|---|---|---|---|---|---|---|---|---|---|---|---|---|---|---|
| Essendon | 19 | 10 | 0.526 | 63% | 37% | 1.895 | 3.211 | 2.421 | +0.789 | |||||||
| Footscray | 19 | 9 | 0.474 | 47% | 11% | 42% | 1.526 | 2.842 | 1.842 | +1.000 | ||||||
| Yarra Valley | 17 | 1 | 0.059 | 59% | 24% | 18% | 2.000 | 2.412 | 1.294 | +1.118 | ||||||
| Altona | 9 | 100% | 3.000 | 3.778 | 0.889 | +2.889 | ||||||||||
| Werribee | 8 | 1 | 0.125 | 100% | 3.000 | 3.625 | 0.250 | +3.375 | ||||||||
| Box Hill | 8 | 1 | 0.125 | 63% | 25% | 13% | 2.125 | 2.375 | 1.125 | +1.250 | ||||||
| Kew | 8 | 1 | 0.125 | 38% | 13% | 50% | 1.250 | 2.125 | 2.125 | +0.000 | ||||||
| Brunswick | 7 | 1 | 0.143 | 57% | 43% | 2.143 | 2.571 | 0.857 | +1.714 | |||||||
| Hawthorn | 7 | 1 | 0.143 | 86% | 14% | 2.714 | 2.714 | 0.571 | +2.143 | |||||||
| Old Haileybury | 7 | 1 | 0.143 | 57% | 29% | 14% | 2.000 | 2.714 | 2.143 | +0.571 | ||||||
| Greensborough | 6 | 3 | 0.500 | 33% | 17% | 50% | 1.167 | 1.833 | 2.167 | -0.333 | ||||||
| PEGS | 6 | 50% | 17% | 33% | 1.667 | 3.333 | 1.667 | +1.667 | ||||||||
| MUHC | 5 | 100% | 3.000 | 5.600 | 0.200 | +5.400 | ||||||||||
| Powerhouse | 5 | 3 | 0.600 | 60% | 20% | 20% | 2.000 | 3.000 | 1.000 | +2.000 | ||||||
| St.Bernards | 5 | 40% | 60% | 1.200 | 1.400 | 3.200 | -1.800 | |||||||||
| RMIT | 5 | 40% | 20% | 40% | 1.400 | 3.400 | 1.600 | +1.800 | ||||||||
| Doncaster | 4 | 25% | 25% | 50% | 1.000 | 1.500 | 1.250 | +0.250 | ||||||||
| Camberwell | 4 | 7 | 1.750 | 100% | 3.000 | 5.750 | 0.750 | +5.000 | ||||||||
| Old Melburnians | 4 | 25% | 75% | 0.750 | 1.500 | 2.500 | -1.000 | |||||||||
| St.Bedes | 4 | 25% | 75% | 0.250 | 0.500 | 3.250 | -2.750 | |||||||||
| MCC | 3 | 33% | 33% | 33% | 1.333 | 3.333 | 3.000 | +0.333 | ||||||||
| Bayside | 3 | 33% | 67% | 1.000 | 2.000 | 2.333 | -0.333 | |||||||||
| Collegians-X | 3 | 67% | 33% | 2.000 | 2.333 | 1.333 | +1.000 | |||||||||
| Swinburne | 3 | 33% | 33% | 33% | 1.333 | 3.667 | 2.333 | +1.333 | ||||||||
| Waverley | 2 | 2 | 1.000 | 100% | 3.000 | 6.500 | 0.000 | +6.500 | ||||||||
| Latrobe Uni | 2 | 100% | 3.000 | 8.000 | 0.000 | +8.000 | ||||||||||
| Ballarat Students | 2 | 50% | 50% | 1.500 | 2.000 | 1.500 | +0.500 | |||||||||
| Old Trinity | 2 | 50% | 50% | 2.000 | 2.000 | 1.000 | +1.000 | |||||||||
| Baw-Baw | 2 | 100% | 0.000 | 0.500 | 3.000 | -2.500 | ||||||||||
| Bendigo | 2 | 100% | 0.000 | 1.000 | 3.500 | -2.500 | ||||||||||
| ECHO | 2 | 100% | 0.000 | 1.000 | 5.500 | -4.500 | ||||||||||
| Lowther Hall | 1 | 3 | 3.000 | 100% | 3.000 | 6.000 | 1.000 | +5.000 | ||||||||
| Old Carey | 1 | 100% | 3.000 | 3.000 | 1.000 | +2.000 | ||||||||||
| Opponents :33 | 185 | 44 | 0.238 | 57% | 13% | 30% | 1.849 | 2.870 | 1.654 | +1.216 |
Playing Venues
| Venue | Games |
Goals | Avge. |
Win % | Draw % | Loss % | Unkn % | Avge. Points |
Avge. For | Avge. Aga | Avge. Diff. |
G.K. Games | Shut- outs | Shut- out % | Goals In | Goals Avge. |
|---|---|---|---|---|---|---|---|---|---|---|---|---|---|---|---|---|
| Melton Mowbray | 71 | 21 | 0.296 | 66% | 15% | 18% | 2.141 | 3.479 | 1.127 | +2.352 | ||||||
| Essendon | 29 | 15 | 0.517 | 55% | 45% | 1.655 | 2.690 | 2.483 | +0.207 | |||||||
| Footscray | 13 | 2 | 0.154 | 62% | 23% | 15% | 2.077 | 2.538 | 0.923 | +1.615 | ||||||
| SHC | 13 | 1 | 0.077 | 31% | 8% | 62% | 1.000 | 1.846 | 2.462 | -0.615 | ||||||
| Elgar Park | 7 | 43% | 57% | 1.286 | 2.143 | 2.143 | +0.000 | |||||||||
| Altona | 6 | 83% | 17% | 2.500 | 2.333 | 1.500 | +0.833 | |||||||||
| Reservoir | 5 | 1 | 0.200 | 100% | 3.000 | 3.800 | 0.000 | +3.800 | ||||||||
| Werribee | 4 | 1 | 0.250 | 100% | 3.000 | 2.750 | 0.250 | +2.500 | ||||||||
| St.Bernards | 4 | 25% | 25% | 50% | 1.000 | 1.000 | 3.000 | -2.000 | ||||||||
| Hawthorn | 3 | 33% | 67% | 1.667 | 1.667 | 1.333 | +0.333 | |||||||||
| Albert Park | 3 | 2 | 0.667 | 100% | 3.000 | 4.667 | 0.333 | +4.333 | ||||||||
| Greensborough | 3 | 33% | 33% | 33% | 1.333 | 2.333 | 2.000 | +0.333 | ||||||||
| Yarra Valley | 3 | 33% | 67% | 0.333 | 0.667 | 4.000 | -3.333 | |||||||||
| Haileybury | 3 | 67% | 33% | 2.333 | 2.667 | 1.667 | +1.000 | |||||||||
| Melbourne Uni | 2 | 100% | 3.000 | 6.000 | 0.500 | +5.500 | ||||||||||
| Waverley | 2 | 50% | 50% | 1.500 | 3.500 | 2.500 | +1.000 | |||||||||
| Melbourne High | 2 | 50% | 50% | 1.500 | 4.000 | 3.500 | +0.500 | |||||||||
| Brunswick | 2 | 1 | 0.500 | 50% | 50% | 2.000 | 3.500 | 2.000 | +1.500 | |||||||
| PEGS | 2 | 50% | 50% | 1.500 | 3.500 | 2.500 | +1.000 | |||||||||
| Brighton | 2 | 100% | 0.000 | 2.000 | 3.500 | -1.500 | ||||||||||
| Doncaster | 1 | 100% | 1.000 | 1.000 | 1.000 | +0.000 | ||||||||||
| Ballarat | 1 | 100% | 0.000 | 2.000 | 3.000 | -1.000 | ||||||||||
| Bendigo | 1 | 100% | 0.000 | 0.000 | 4.000 | -4.000 | ||||||||||
| Mentone | 1 | 100% | 1.000 | 1.000 | 1.000 | +0.000 | ||||||||||
| Churchill | 1 | 100% | 0.000 | 0.000 | 3.000 | -3.000 | ||||||||||
| Monash | 1 | 100% | 0.000 | 1.000 | 4.000 | -3.000 | ||||||||||
| Venues :26 | 185 | 44 | 0.238 | 57% | 13% | 30% | 1.849 | 2.870 | 1.654 | +1.216 |