 |
Melton Hockey Club |
 |
Last updated : 11:18 am - 2 November 2023
Club Cap : 215
(Games : 139, Goals : 2 )
Milestones
| 1988-Apr-16 : | First game (R-01: 1988 U9 North (R)) |
| 1990-Jan-17 : | 50 Junior games (Melton 1 def. Ajax-Maccabi 0. R-17: 1990 U11 North) |
| 1992-Nov-20 : | 100 Junior games (Altona (Blue) 8 def. Melton 2. R-02: 1992/93 U13 Altona) |
| 1994-Mar-25 : | First goal scored (Melton 2 def. Footscray 0. R-01: 1994 U15 Pennant) |
| 1994-Apr-22 : | Last game played (Melton 0 drew Croydon 0. R-03: 1994 U15 Pennant) |
| Playing career : 2197 days. (6 years and 7 days.) |
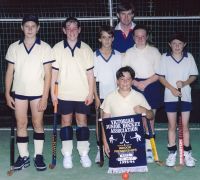
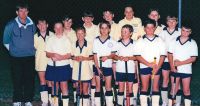
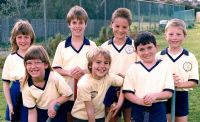
Team Photographs
Complete Playing History
Teams played with : 11
Premierships won : 2
Wooden Spoons : 1
| Games as Player |
Games Won | Games Drawn | Games Lost | Games Unkn. |
Total | Goals | Goalscoring Average |
|---|---|---|---|---|---|---|---|
| Junior Winter | 40 | 18 | 27 | 18 | 103 | 2 | 0.029 |
| Junior Summer | 15 | 1 | 6 | 14 | 36 | 0 | 0.000 |
| Junior Total | 55 | 19 | 33 | 32 | 139 | 2 | 0.029 |
| Pos. | PR/WS | Div. | Competition | Games | Goals | Avge. | Won | Drawn | Lost | Unkn | Avge.For | Avge.Aga | Avge.Diff | G.For | G.Aga | GoalDiff |
|---|---|---|---|---|---|---|---|---|---|---|---|---|---|---|---|---|
| 8 | 1994 U15 Pennant* | 3 | 2 | 0.667 | 2 | 1 | 2.000 | 0.000 | +2.000 | 6 | 0 | +006 | ||||
| 1 | PR | 1993/94 U13 Altona* | 10 | 8 | 1 | 1 | 9.500 | 1.500 | +8.000 | 95 | 15 | +080 | ||||
| 6 | 1993 U13 Pennant* | 18 | 7 | 4 | 7 | 1.444 | 1.611 | -0.167 | 26 | 29 | -003 | |||||
| 2 | 1992/93 U15 Altona | 1 | 1 | 16.000 | 0.000 | +16.000 | 16 | 0 | +016 | |||||||
| 3 | 1992/93 U13 Altona | 9 | 4 | 5 | 3.333 | 5.333 | -2.000 | 30 | 48 | -018 | ||||||
| 3 | 1992 U13 Pennant | 14 | 6 | 3 | 5 | 2.000 | 1.429 | +0.571 | 28 | 20 | +008 | |||||
| 1 | PR | 1991/92 U13 Indoor* | 16 | 2 | 14 | 1.500 | 0.000 | +1.500 | 3 | 0 | +003 | |||||
| 7 | 1991 U13 Pennant | 16 | 4 | 3 | 9 | 0.875 | 2.563 | -1.688 | 14 | 41 | -027 | |||||
| 2 | 1990 U11 North* | 18 | 12 | 2 | 4 | 3.389 | 0.833 | +2.556 | 61 | 15 | +046 | |||||
| 3 | 1989 U9 North (Red)* | 16 | 9 | 5 | 2 | 2.125 | 0.500 | +1.625 | 34 | 8 | +026 | |||||
| 4 | WS | 1988 U9 North (R)* | 18 | 18 | 0.000 | 0.000 | +0.000 | 0 | 0 | +000 | ||||||
| 139 | 2 | 0.019 | 55 | 19 | 33 | 32 | 3.010 | 1.645 | +1.280 | 313 | 176 | +137 |
Junior Winter Playing History
| Games as Player |
Games Won | Games Drawn | Games Lost | Games Unkn. |
Total | Goals | Goalscoring Average |
|---|---|---|---|---|---|---|---|
| Junior Winter | 40 | 18 | 27 | 18 | 103 | 2 | 0.029 |
| First Game : | R-01: 1988 U9 North (R) |
| Last Game : | Melton 0 drew Croydon 0. R-03: 1994 U15 Pennant |
| Best Win : | Melton 15 def. Essendon 0. R-18: 1990 U11 North |
| Worst Loss : | Camberwell 12 def. Melton 1. R-03: 1991 U13 Pennant |
| 1 goal games : | 2 times. Last : Melton 4 def. Frankston 0. R-02: 1994 U15 Pennant |
| Finals : | Altona 3 def. Melton 0. SF: 1990 U11 North TEMC 7 def. Melton 1. SF: 1992 U13 Pennant |
| Premierships : | None. |
Junior Summer Playing History
| Games as Player |
Games Won | Games Drawn | Games Lost | Games Unkn. |
Total | Goals | Goalscoring Average |
|---|---|---|---|---|---|---|---|
| Junior Summer | 15 | 1 | 6 | 14 | 36 | 0 | 0.000 |
| First Game : | Melton ? v MUHC ?. R-01: 1991/92 U13 Indoor |
| Last Game : | Melton 0 def. ???? 0. GF: 1993/94 U13 Altona |
| Best Win : | Melton 29 def. Altona (White) 0. R-08: 1993/94 U13 Altona |
| Worst Loss : | Werribee 13 def. Melton 2. R-01: 1992/93 U13 Altona |
| Finals : | Melton 3 def. Essendon 0. GF: 1991/92 U13 Indoor Melton 0 def. RMIT 0. SF: 1991/92 U13 Indoor Altona (Gold) 4 def. Melton 3. CF: 1992/93 U13 Altona Melton 0 def. ???? 0. GF: 1993/94 U13 Altona Melton 0 def. Altona (White) 0. SF: 1993/94 U13 Altona |
| Premierships : | Melton 3 def. Essendon 0. GF: 1991/92 U13 Indoor Melton 0 def. ???? 0. GF: 1993/94 U13 Altona |
Teammates
Number of teammates :34
| Player |
Games |
Win % | Draw % | Loss % | Unkn % | Avge. Points |
Avge. For | Avge. Aga | Avge. Diff. |
|---|---|---|---|---|---|---|---|---|---|
| Shadbolt, Narelle* | 130 | 38% | 15% | 23% | 25% | 1.694 | 2.776 | 1.684 | +1.092 |
| Bauer, Andrew* | 119 | 36% | 15% | 22% | 27% | 1.690 | 2.161 | 1.287 | +0.874 |
| Lake, Melissa* | 119 | 36% | 15% | 22% | 27% | 1.690 | 2.149 | 1.253 | +0.897 |
| Treganowan, Daryn* | 115 | 42% | 11% | 19% | 28% | 1.892 | 3.277 | 1.446 | +1.831 |
| Spence, Matthew* | 89 | 34% | 11% | 19% | 36% | 1.754 | 2.368 | 1.544 | +0.825 |
| Bedggood, Stephen* | 86 | 31% | 10% | 21% | 37% | 1.667 | 2.370 | 1.407 | +0.963 |
| McAleer, Joseph* | 50 | 40% | 14% | 10% | 36% | 2.094 | 2.813 | 0.594 | +2.219 |
| Simpson, Matthew* | 50 | 56% | 14% | 30% | 1.820 | 3.720 | 1.900 | +1.820 | |
| Spence, Dion* | 43 | 35% | 9% | 23% | 33% | 1.690 | 4.414 | 1.931 | +2.483 |
| MacKinnon, Andrew* | 35 | 14% | 9% | 26% | 51% | 1.059 | 1.765 | 2.412 | -0.647 |
| Sparks, Sarah* | 35 | 51% | 11% | 37% | 1.657 | 4.257 | 2.600 | +1.657 | |
| Morritt, Sharon* | 33 | 15% | 9% | 21% | 55% | 1.200 | 0.933 | 2.067 | -1.133 |
| Lawrence, Geoffrey* | 30 | 57% | 17% | 27% | 1.867 | 2.900 | 1.100 | +1.800 | |
| Lawrence, Daryl* | 29 | 52% | 17% | 31% | 1.724 | 2.690 | 1.172 | +1.517 | |
| MacKinnon, Tim* | 29 | 59% | 17% | 24% | 1.931 | 2.966 | 1.034 | +1.931 | |
| Fraser, Darren | 29 | 34% | 21% | 45% | 1.241 | 1.448 | 2.000 | -0.552 | |
| Dart, Scott* | 27 | 44% | 15% | 41% | 1.481 | 2.000 | 1.852 | +0.148 | |
| Mills, Kate* | 26 | 42% | 12% | 46% | 1.385 | 2.115 | 2.923 | -0.808 | |
| Wordley, Paul | 19 | 42% | 16% | 42% | 1.421 | 2.368 | 3.105 | -0.737 | |
| Cunningham, Chris | 18 | 39% | 22% | 39% | 1.389 | 1.444 | 1.611 | -0.167 | |
| Watson, Greg | 18 | 39% | 22% | 39% | 1.389 | 1.444 | 1.611 | -0.167 | |
| Simpson, Danielle* | 17 | 71% | 12% | 18% | 2.235 | 3.471 | 0.647 | +2.824 | |
| McNair, Anthony* | 17 | 47% | 24% | 29% | 1.647 | 2.000 | 1.176 | +0.824 | |
| Forder, Jeremy* | 16 | 56% | 31% | 13% | 2.000 | 2.125 | 0.500 | +1.625 | |
| Treganowan, Emily | 16 | 56% | 31% | 13% | 2.000 | 2.125 | 0.500 | +1.625 | |
| Mills, Steven* | 16 | 31% | 13% | 56% | 1.063 | 1.813 | 2.500 | -0.688 | |
| Walton, Aaron* | 13 | 31% | 23% | 46% | 1.154 | 1.154 | 1.846 | -0.692 | |
| Remedios, Chris | 12 | 25% | 25% | 50% | 1.500 | 3.500 | 6.667 | -3.167 | |
| Hayward, Josie | 12 | 17% | 25% | 58% | 0.750 | 0.667 | 3.000 | -2.333 | |
| Ind, Paul | 11 | 27% | 27% | 45% | 1.091 | 0.909 | 1.727 | -0.818 | |
| Bonnici, Tania* | 3 | 67% | 33% | 2.333 | 2.000 | 0.000 | +2.000 | ||
| Brown, Daniel* | 3 | 67% | 33% | 2.333 | 2.000 | 0.000 | +2.000 | ||
| Sorensen, Steven* | 3 | 67% | 33% | 2.333 | 2.000 | 0.000 | +2.000 | ||
| Whitehead, Matthew | 1 | 100% | 1.000 | 1.000 | 1.000 | +0.000 |
Opposition Teams
| Opponent |
Games |
Goals | Avge |
Win % | Draw % | Loss % | Unkn % | Avge. Points |
Avge. For | Avge. Aga | Avge. Diff. |
G.K. Games | Shut- outs | Shut- out % | Goals In | Goals Avge |
|---|---|---|---|---|---|---|---|---|---|---|---|---|---|---|---|---|
| Altona | 21 | 48% | 19% | 33% | 1.619 | 4.619 | 1.952 | +2.667 | ||||||||
| Not Recorded | 18 | 100% | 0.000 | 0.000 | +0.000 | |||||||||||
| Essendon | 14 | 64% | 21% | 14% | 2.500 | 4.250 | 0.417 | +3.833 | ||||||||
| Werribee | 8 | 63% | 38% | 1.875 | 2.750 | 4.250 | -1.500 | |||||||||
| Reservoir | 8 | 25% | 50% | 25% | 1.000 | 2.667 | 1.833 | +0.833 | ||||||||
| MUHC | 7 | 57% | 14% | 29% | 2.400 | 2.400 | 0.600 | +1.800 | ||||||||
| Croydon | 7 | 43% | 29% | 29% | 1.571 | 1.571 | 0.857 | +0.714 | ||||||||
| TEMC | 6 | 17% | 83% | 0.167 | 0.667 | 3.333 | -2.667 | |||||||||
| Brunswick | 5 | 20% | 20% | 60% | 0.800 | 1.400 | 2.600 | -1.200 | ||||||||
| Camberwell | 4 | 25% | 25% | 50% | 1.000 | 0.750 | 4.000 | -3.250 | ||||||||
| Dandenong | 4 | 50% | 50% | 1.500 | 1.750 | 2.000 | -0.250 | |||||||||
| Ajax-Maccabi | 3 | 100% | 3.000 | 2.333 | 0.000 | +2.333 | ||||||||||
| Sandringham | 3 | 67% | 33% | 0.667 | 0.333 | 1.333 | -1.000 | |||||||||
| RMIT | 3 | 33% | 67% | 3.000 | 0.000 | 0.000 | +0.000 | |||||||||
| MCC | 3 | 100% | 3.000 | 2.333 | 0.667 | +1.667 | ||||||||||
| Elsternwick | 3 | 67% | 33% | 0.667 | 0.000 | 1.333 | -1.333 | |||||||||
| Frankston | 3 | 1 | 0.333 | 100% | 3.000 | 3.333 | 0.667 | +2.667 | ||||||||
| Footscray | 3 | 1 | 0.333 | 100% | 3.000 | 12.000 | 0.333 | +11.667 | ||||||||
| Melton | 2 | 100% | 3.000 | 6.000 | 0.000 | +6.000 | ||||||||||
| Hawthorn | 2 | 50% | 50% | 2.000 | 1.500 | 0.500 | +1.000 | |||||||||
| Greensborough | 2 | 100% | 0.000 | 0.000 | +0.000 | |||||||||||
| Sunshine | 2 | 100% | 0.000 | 0.000 | +0.000 | |||||||||||
| Strathmore Park | 2 | 100% | 0.000 | 0.000 | +0.000 | |||||||||||
| Yarra Valley | 2 | 50% | 50% | 0.500 | 0.000 | 0.500 | -0.500 | |||||||||
| Doncaster | 2 | 50% | 50% | 0.500 | 1.000 | 2.000 | -1.000 | |||||||||
| Powerhouse | 1 | 100% | 3.000 | 5.000 | 0.000 | +5.000 | ||||||||||
| ???? | 1 | 100% | 3.000 | 0.000 | 0.000 | +0.000 | ||||||||||
| Opponents :27 | 139 | 2 | 0.014 | 40% | 14% | 24% | 23% | 1.720 | 2.925 | 1.645 | +1.280 |
Playing Venues
| Venue | Games |
Goals | Avge. |
Win % | Draw % | Loss % | Unkn % | Avge. Points |
Avge. For | Avge. Aga | Avge. Diff. |
G.K. Games | Shut- outs | Shut- out % | Goals In | Goals Avge. |
|---|---|---|---|---|---|---|---|---|---|---|---|---|---|---|---|---|
| Not Recorded | 82 | 38% | 16% | 24% | 22% | 1.656 | 2.141 | 1.313 | +0.828 | |||||||
| Altona | 22 | 64% | 5% | 32% | 1.955 | 6.545 | 3.091 | +3.455 | ||||||||
| Essendon Indoor | 16 | 13% | 88% | 3.000 | 1.500 | 0.000 | +1.500 | |||||||||
| Monash | 3 | 67% | 33% | 2.000 | 1.667 | 1.333 | +0.333 | |||||||||
| SHC | 3 | 67% | 33% | 2.333 | 1.667 | 0.000 | +1.667 | |||||||||
| Doncaster | 3 | 67% | 33% | 0.667 | 0.333 | 0.667 | -0.333 | |||||||||
| Essendon | 3 | 1 | 0.333 | 33% | 67% | 1.000 | 2.000 | 2.333 | -0.333 | |||||||
| Olympic Park | 2 | 50% | 50% | 1.500 | 2.000 | 2.000 | +0.000 | |||||||||
| PEGS | 2 | 50% | 50% | 1.500 | 2.000 | 2.500 | -0.500 | |||||||||
| Hawthorn | 1 | 100% | 1.000 | 1.000 | 1.000 | +0.000 | ||||||||||
| Waverley | 1 | 100% | 1.000 | 1.000 | 1.000 | +0.000 | ||||||||||
| Footscray | 1 | 1 | 1.000 | 100% | 3.000 | 2.000 | 0.000 | +2.000 | ||||||||
| Venues :12 | 139 | 2 | 0.014 | 40% | 14% | 24% | 23% | 1.720 | 2.925 | 1.645 | +1.280 |
