 |
Melton Hockey Club |
|
Last updated : 12:05 pm - 14 April 2024
Club Cap : 471
(Games : 324, Goals : 115 )
First XI Men's Cap : 124
(Games : 79, Goals : 2)
Games Umpired : 2
(Senior : 0, Veteran : 0, Junior : 2)
Games Coached : 16
(Senior : 0, Veteran : 0, Junior : 16)
Milestones
| 2000-Apr-01 : | First Junior game (Melton 1 def. Hawthorn (B) 0. R-01: 2000 U11 North) |
| 2000-Apr-01 : | First game (Melton 1 def. Hawthorn (B) 0. R-01: 2000 U11 North) |
| 2000-Apr-08 : | First goal scored (Melton 2 def. Essendon (B) 1. R-02: 2000 U11 North) |
| 2002-May-10 : | 50 Junior games (Hawthorn 3 def. Melton 2. R-04: 2002 U13 Pennant North) |
| 2002-May-19 : | First Senior game (MUHC 6 def. Melton 5. R-04: 2002 Metro 4 West Men) |
| 2002-Nov-26 : | First Senior goal (RMIT 4 def. Melton 3. R-03: 2002/03 Footscray Tue. Men) |
| 2005-Feb-18 : | 100 Junior games (Melton 8 def. Essendon (L) 1. R-09: 2004/05 U17 Essendon Friday) |
| 2006-Sep-15 : | Last Junior game (Melton 1 def. St.Bernards 0. GF: 2006 U17 North) |
| 2008-May-24 : | First First XI Mens game (Melton 4 drew Vic Sihks 4. R-06: 2008 State League 4 Men) |
| 2019-May-04 : | First game coached (Altona 1 def. Melton 0. R-01: 2019 U10 North/West (G)) |
| 2019-Sep-07 : | Last game coached (Melton 3 def. Werribee (Y) 1. R-16: 2019 U10 North/West (G)) |
| 2021-Jul-10 : | 300 Club games (Melton 8 def. Glen Eira 1. R-09: 2021 Vic League 3 Men) |
| 2022-May-21 : | First game umpired (Melton 5 def. Werribee 0. R-03: 2022 U12 Pennant North/West) |
| 2022-Jun-04 : | Last game umpired (Essendon (R) 1 def. Melton 0. R-05: 2022 U12 Pennant North/West) |
| 2023-Aug-19 : | Last First XI Mens game played (Bayside 3 def. Melton 2. R-17: 2023 Vic League 3 Men) |
| 2024-Apr-13 : | Last Senior game (Melton 3 def. Essendon 1. R-01: 2024 Metro 2 North/West Men) |
| 2024-Apr-13 : | Last game played (Melton 3 def. Essendon 1. R-01: 2024 Metro 2 North/West Men) |
| Playing career : 8778 days. (24 years and 18 days.) |
Honours, Trophies, and Official Roles
| Shane Bailey Award : | 2018/19 |
| Top Junior Scorer (Win.) : | 1999/00 |
| Top Junior Scorer (Sum.) : | 2004/05 |
| Best and Fairest : | 2000-U11 North, 2001/02-Altona U13 Indoor, 2002-U13 Pennant North |
| B&F Runner Up : | 2007-Metro 3 West Men, 2013-Metro 3 West (B) |
| Coach's Award : | 2001-U13 North |
| Coach : | 2019-U10 North/West (G) |
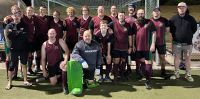
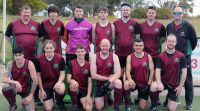
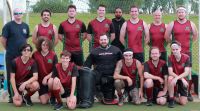
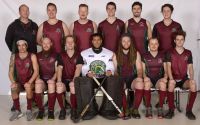
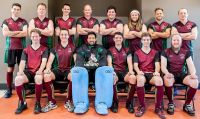
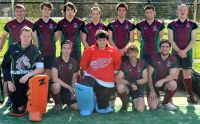
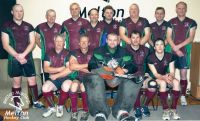
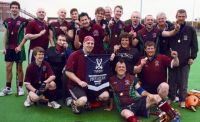
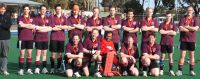
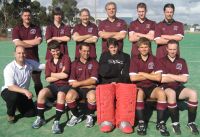
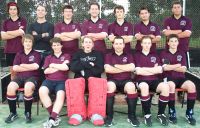
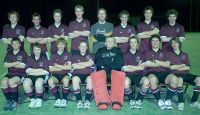
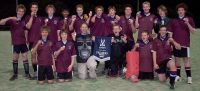
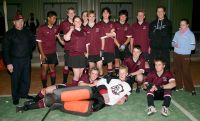
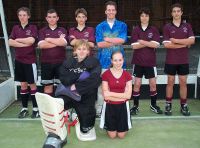
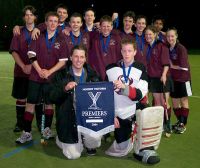
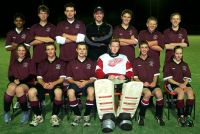
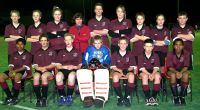
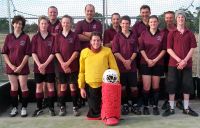
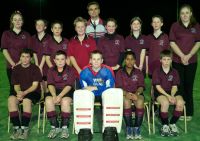
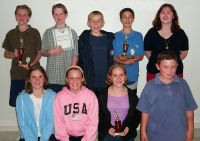
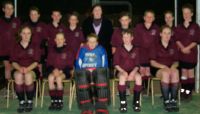
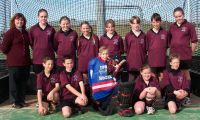
Team Photographs

Complete Playing History
Teams played with : 40
Premierships won : 3
Wooden Spoons : 3
| Games as Player |
Games Won | Games Drawn | Games Lost | Total | Goals | Goalscoring Average |
|---|---|---|---|---|---|---|
| Junior Winter | 54 | 12 | 41 | 107 | 49 | 0.458 |
| Junior Summer | 11 | 2 | 13 | 26 | 28 | 1.077 |
| Junior Total | 65 | 14 | 54 | 133 | 77 | 0.579 |
| Senior Winter | 88 | 25 | 68 | 181 | 36 | 0.200 |
| Senior Summer | 3 | 1 | 6 | 10 | 2 | 0.222 |
| Senior Total | 91 | 26 | 74 | 191 | 38 | 0.201 |
| Total | 156 | 40 | 128 | 324 | 115 | 0.357 |
| Pos. | PR/WS | Div. | Competition | Games | Goals | Avge. | Won | Drawn | Lost | Avge.For | Avge.Aga | Avge.Diff | G.For | G.Aga | GoalDiff |
|---|---|---|---|---|---|---|---|---|---|---|---|---|---|---|---|
| ? | 2024 Metro 1 North/West Men | 1 | 1 | 3.000 | 0.000 | +3.000 | 3 | 0 | +003 | ||||||
| ? | 2024 Metro 2 North/West Men* | 1 | 1 | 3.000 | 1.000 | +2.000 | 3 | 1 | +002 | ||||||
| 5 | 2023 Vic League 3 Men* | 14 | 5 | 2 | 7 | 2.714 | 2.643 | +0.071 | 38 | 37 | +001 | ||||
| 3 | 2022 Vic League 3 Men* | 8 | 3 | 3 | 2 | 3.875 | 2.625 | +1.250 | 31 | 21 | +010 | ||||
| 4 | 2021 Vic League 3 Men | 8 | 4 | 3 | 1 | 3.250 | 1.750 | +1.500 | 26 | 14 | +012 | ||||
| 5 | 2019 Vic League 3 Men* | 15 | 8 | 2 | 5 | 3.067 | 2.000 | +1.067 | 46 | 30 | +016 | ||||
| 4 | 2019 Pennant G Men* | 5 | 3 | 2 | 2.600 | 1.800 | +0.800 | 13 | 9 | +004 | |||||
| 5 | 2018 Vic League 3 Men* | 15 | 6 | 9 | 3.400 | 2.867 | +0.533 | 51 | 43 | +008 | |||||
| 7 | 2015 Vic League 3 Men* | 6 | 2 | 4 | 1.500 | 2.833 | -1.333 | 9 | 17 | -008 | |||||
| 1 | 2015 Vic League 3 Res. Men* | 2 | 2 | 4.500 | 1.500 | +3.000 | 9 | 3 | +006 | ||||||
| 7 | 2014 Vic League 3 Men* | 4 | 2 | 2 | 2.750 | 4.250 | -1.500 | 11 | 17 | -006 | |||||
| 3 | 2014 Vic League 3 Res. Men* | 15 | 6 | 0.400 | 8 | 3 | 4 | 2.533 | 1.333 | +1.200 | 38 | 20 | +018 | ||
| 6 | 2013 Vic League 3 Men* | 1 | 1 | 2.000 | 1.000 | +1.000 | 2 | 1 | +001 | ||||||
| 7 | 2013 Vic League 3 Res. Men* | 2 | 1 | 1 | 2.500 | 2.500 | +0.000 | 5 | 5 | +000 | |||||
| 3 | 2013 Metro 3 West (M)* | 5 | 3 | 0.600 | 3 | 2 | 3.800 | 2.800 | +1.000 | 19 | 14 | +005 | |||
| 5 | 2013 Metro 3 West (B)* | 7 | 4 | 0.571 | 3 | 1 | 3 | 1.571 | 2.857 | -1.286 | 11 | 20 | -009 | ||
| 10 | WS | 2010 State League 4 Men* | 4 | 1 | 0.250 | 4 | 0.750 | 4.250 | -3.500 | 3 | 17 | -014 | |||
| 1 | PR | 2010 Metro 2 West Men* | 12 | 2 | 0.167 | 9 | 2 | 1 | 5.333 | 2.500 | +2.833 | 64 | 30 | +034 | |
| 7 | 2010 Metro 3 West Men* | 1 | 1 | 0.000 | 8.000 | -8.000 | 0 | 8 | -008 | ||||||
| 8 | 2009 State League 4 Men* | 3 | 1 | 0.333 | 1 | 2 | 1.667 | 3.000 | -1.333 | 5 | 9 | -004 | |||
| 2 | 2009 Metro 2 West Men* | 16 | 8 | 0.500 | 11 | 2 | 3 | 4.875 | 1.563 | +3.313 | 78 | 25 | +053 | ||
| 5 | 2008 State League 4 Men* | 1 | 1 | 4.000 | 4.000 | +0.000 | 4 | 4 | +000 | ||||||
| 6 | 2008 Metro 2 West Men* | 14 | 6 | 0.429 | 6 | 2 | 6 | 2.000 | 2.071 | -0.071 | 28 | 29 | -001 | ||
| 3 | 2007 Metro 2 West Men* | 3 | 3 | 0.333 | 1.333 | -1.000 | 1 | 4 | -003 | ||||||
| 5 | 2007 Metro 3 West Men* | 14 | 5 | 0.357 | 5 | 4 | 5 | 2.571 | 2.071 | +0.500 | 36 | 29 | +007 | ||
| 1 | 2006 Metro 4 West Men* | 1 | 1 | 4.000 | 2.000 | +2.000 | 4 | 2 | +002 | ||||||
| 1 | PR | 2006 U17 North* | 14 | 1 | 0.071 | 10 | 2 | 2 | 2.571 | 0.786 | +1.786 | 36 | 11 | +025 | |
| 3 | 2005/06 U17 Essendon Friday* | 3 | 3 | 1.000 | 2 | 1 | 4.333 | 2.000 | +2.333 | 13 | 6 | +007 | |||
| 8 | 2005 U17 Pennant North* | 15 | 4 | 0.267 | 6 | 1 | 8 | 2.000 | 2.267 | -0.267 | 30 | 34 | -004 | ||
| 2 | 2004/05 U17 Essendon Friday* | 9 | 14 | 1.556 | 6 | 1 | 2 | 4.667 | 2.556 | +2.111 | 42 | 23 | +019 | ||
| 1 | PR | 2004 U17* | 17 | 14 | 0.824 | 17 | 4.941 | 0.706 | +4.235 | 84 | 12 | +072 | |||
| 2 | 2003 Metro 4 West Men* | 2 | 2 | 3.500 | 1.500 | +2.000 | 7 | 3 | +004 | ||||||
| 5 | 2003 U15 North* | 14 | 8 | 0.571 | 7 | 1 | 6 | 2.571 | 2.500 | +0.071 | 36 | 35 | +001 | ||
| 5 | 2002/03 Footscray Tue. Men* | 10 | 2 | 0.200 | 3 | 1 | 6 | 1.500 | 3.800 | -2.300 | 15 | 38 | -023 | ||
| 3 | 2002 Metro 4 West Men* | 1 | 1 | 5.000 | 6.000 | -1.000 | 5 | 6 | -001 | ||||||
| 9 | WS | 2002 U13 Pennant North* | 15 | 5 | 0.333 | 3 | 12 | 0.667 | 3.267 | -2.600 | 10 | 49 | -039 | ||
| 7 | 2001/02 Altona U13 Indoor* | 7 | 4 | 0.571 | 2 | 1 | 4 | 2.000 | 4.714 | -2.714 | 14 | 33 | -019 | ||
| 8 | 2001 U13 North* | 16 | 3 | 0.188 | 4 | 3 | 9 | 1.000 | 2.188 | -1.188 | 16 | 35 | -019 | ||
| 12 | WS | 2000/01 Altona U13 Indoor | 7 | 7 | 1.000 | 1 | 6 | 2.286 | 4.857 | -2.571 | 16 | 34 | -018 | ||
| 3 | 2000 U11 North* | 16 | 14 | 0.875 | 10 | 2 | 4 | 1.750 | 0.875 | +0.875 | 28 | 14 | +014 | ||
| 324 | 115 | 0.355 | 156 | 40 | 128 | 2.755 | 2.290 | +0.457 | 890 | 742 | +148 |
Coaching History
Teams coached : 1
Premierships won : 0
Wooden Spoons : 0
| Games as Coach |
Games Won | Games Drawn | Games Lost | Total | Win % | Average Goals For |
Average Goals Aga |
Average Diff. |
|---|---|---|---|---|---|---|---|---|
| Junior Winter | 2 | 2 | 12 | 16 | 13% | 1.438 | 4.813 | -3.375 |
| Pos. | PR/WS | Div. | Competition | Games | Win % | Won | Drawn | Lost | Avge. For | Avge.Aga | Avge.Diff | G.For | G.Aga | GoalDiff |
|---|---|---|---|---|---|---|---|---|---|---|---|---|---|---|
| 8 | 2019 U10 North/West (G)* | 16 | 13% | 2 | 2 | 12 | 1.438 | 4.813 | -3.375 | 23 | 77 | -054 |
Umpiring History
Year    Division                      SEN VET JUN
2022    U12 Pennant North/West                  2

SUBTOTAL                                        2
TOTAL                                           2
Junior Winter Playing History
| Games as Player |
Games Won | Games Drawn | Games Lost | Total | Goals | Goalscoring Average |
|---|---|---|---|---|---|---|
| Junior Winter | 54 | 12 | 41 | 107 | 49 | 0.458 |
| First Game : | Melton 1 def. Hawthorn (B) 0. R-01: 2000 U11 North |
| Last Game : | Melton 1 def. St.Bernards 0. GF: 2006 U17 North |
| Best Win : | Melton 10 def. Waverley 0. R-06: 2004 U17 |
| Worst Loss : | Werribee 9 def. Melton 0. R-15: 2002 U13 Pennant North |
| 1 goal games : | 24 times. Last : Melton 6 def. MCC 0. R-15: 2006 U17 North |
| 2 goal games : | 9 times. Last : Melton 5 def. Yarra Valley 0. R-09: 2005 U17 Pennant North |
| 3 goal games : | 1 times. Last : Melton 5 def. Essendon (B) 0. R-13: 2000 U11 North |
| 4 goal games : | 1 times. Last : Melton 6 def. Werribee 0. R-03: 2004 U17 |
| Finals : | Footscray 4 def. Melton 1. SF: 2000 U11 North Melton 3 def. Yarra Valley 2. GF: 2004 U17 Melton 1 def. Camberwell 1. SF: 2004 U17 Melton 1 def. St.Bernards 0. GF: 2006 U17 North Melton 4 def. Hawthorn 1. SF: 2006 U17 North |
| Premierships : | Melton 3 def. Yarra Valley 2. GF: 2004 U17 Melton 1 def. St.Bernards 0. GF: 2006 U17 North |
Junior Summer Playing History
| Games as Player |
Games Won | Games Drawn | Games Lost | Total | Goals | Goalscoring Average |
|---|---|---|---|---|---|---|
| Junior Summer | 11 | 2 | 13 | 26 | 28 | 1.077 |
| First Game : | Melton 5 def. MUHC 1. R-01: 2000/01 Altona U13 Indoor |
| Last Game : | Melton 3 def. Essendon (H) 2. R-05: 2005/06 U17 Essendon Friday |
| Best Win : | Melton 8 def. Essendon (L) 1. R-04: 2005/06 U17 Essendon Friday |
| Worst Loss : | Altona (B) 13 def. Melton 3. R-08: 2001/02 Altona U13 Indoor |
| 1 goal games : | 7 times. Last : Melton 3 def. Essendon (H) 2. R-05: 2005/06 U17 Essendon Friday |
| 2 goal games : | 3 times. Last : Melton 8 def. Essendon (L) 1. R-04: 2005/06 U17 Essendon Friday |
| 3 goal games : | 5 times. Last : Melton 8 def. Essendon (L) 1. R-09: 2004/05 U17 Essendon Friday |
| Finals : | None. |
| Premierships : | None. |
Senior Winter Playing History
| Games as Player |
Games Won | Games Drawn | Games Lost | Total | Goals | Goalscoring Average |
|---|---|---|---|---|---|---|
| Senior Winter | 88 | 25 | 68 | 181 | 36 | 0.200 |
| First Game : | MUHC 6 def. Melton 5. R-04: 2002 Metro 4 West Men |
| Last Game : | Melton 3 def. Essendon 1. R-01: 2024 Metro 2 North/West Men |
| Best Win : | Melton 14 def. Latrobe Uni 0. R-08: 2009 Metro 2 West Men |
| Worst Loss : | Knox 9 def. Melton 0. R-15: 2010 State League 4 Men |
| 1 goal games : | 20 times. Last : Melton 5 def. Swinburne 1. R-17: 2014 Vic League 3 Res. Men |
| 2 goal games : | 5 times. Last : Melton 5 def. Swinburne 0. R-07: 2014 Vic League 3 Res. Men |
| 3 goal games : | 2 times. Last : Melton 6 def. Essendon 1. R-03: 2009 Metro 2 West Men |
| Finals : | Altona 1 def. Melton 0. PF: 2007 Metro 2 West Men Old Melburnians 1 def. Melton 0. SF: 2007 Metro 2 West Men Footscray 4 def. Melton 2. GF: 2009 Metro 2 West Men Melton 4 def. PEGS 0. PF: 2009 Metro 2 West Men Footscray 4 def. Melton 2. SF: 2009 Metro 2 West Men Melton 6 def. Altona 4. GF: 2010 Metro 2 West Men Melton 7 def. Footscray 1. PF: 2010 Metro 2 West Men Altona 8 def. Melton 6. QF: 2010 Metro 2 West Men Melton 8 def. Footscray (R) 1. EF: 2013 Metro 3 West (M) Werribee (B) 3 def. Melton 1. PF: 2013 Metro 3 West (M) Melton 6 def. Bayside 1. EF: 2014 Vic League 3 Res. Men Old Melburnians 1 def. Melton 1. PF: 2014 Vic League 3 Res. Men |
| Premierships : | Melton 6 def. Altona 4. GF: 2010 Metro 2 West Men |
Senior Summer Playing History
| Games as Player |
Games Won | Games Drawn | Games Lost | Total | Goals | Goalscoring Average |
|---|---|---|---|---|---|---|
| Senior Summer | 3 | 1 | 6 | 10 | 2 | 0.222 |
| First Game : | Melton 2 def. PEGS 0. R-01: 2002/03 Footscray Tue. Men |
| Last Game : | PEGS 9 def. Melton 0. QF: 2002/03 Footscray Tue. Men |
| Best Win : | Melton 5 def. Ballarat 0. R-02: 2002/03 Footscray Tue. Men |
| Worst Loss : | PEGS 9 def. Melton 0. QF: 2002/03 Footscray Tue. Men |
| 2 goal games : | 1 times. Last : RMIT 4 def. Melton 3. R-03: 2002/03 Footscray Tue. Men |
| Finals : | PEGS 9 def. Melton 0. QF: 2002/03 Footscray Tue. Men |
| Premierships : | None. |
Teammates
Number of teammates :176
| Player |
Games |
Win % | Draw % | Loss % | Unkn % | Avge. Points |
Avge. For | Avge. Aga | Avge. Diff. |
|---|---|---|---|---|---|---|---|---|---|
| Mumford, Matthew* | 139 | 40% | 12% | 49% | 1.302 | 2.209 | 2.525 | -0.317 | |
| Self, Ryan* | 130 | 52% | 10% | 38% | 1.646 | 2.962 | 2.108 | +0.854 | |
| Spence, Adam* | 114 | 43% | 15% | 42% | 1.439 | 2.219 | 2.325 | -0.105 | |
| Downs, Andrew* | 88 | 45% | 11% | 43% | 1.477 | 2.443 | 2.318 | +0.125 | |
| Clough, Jarryd* | 87 | 60% | 16% | 24% | 1.954 | 3.437 | 1.759 | +1.678 | |
| Lawrence, Jesse* | 87 | 46% | 15% | 39% | 1.529 | 3.046 | 2.322 | +0.724 | |
| Spence, Jessica* | 82 | 51% | 9% | 40% | 1.622 | 2.793 | 2.451 | +0.341 | |
| Matthews, Ben* | 82 | 61% | 10% | 29% | 1.927 | 3.024 | 1.732 | +1.293 | |
| Thomas, Joshua* | 71 | 38% | 15% | 46% | 1.296 | 2.268 | 2.296 | -0.028 | |
| Sproal, Beth* | 67 | 33% | 12% | 55% | 1.104 | 1.716 | 2.731 | -1.015 | |
| Noonan, Kristian* | 67 | 57% | 12% | 31% | 1.821 | 2.910 | 1.970 | +0.940 | |
| Doran, Dale* | 65 | 34% | 15% | 51% | 1.169 | 1.631 | 2.415 | -0.785 | |
| Arnold, Andrew* | 65 | 55% | 9% | 35% | 1.754 | 3.154 | 2.231 | +0.923 | |
| Lawrence, Hayden* | 65 | 45% | 15% | 40% | 1.492 | 3.154 | 2.369 | +0.785 | |
| Doran, Kimberly* | 64 | 36% | 16% | 48% | 1.234 | 1.734 | 2.344 | -0.609 | |
| Buttigieg, William* | 64 | 33% | 17% | 50% | 1.156 | 2.031 | 2.797 | -0.766 | |
| Hosking, Michael* | 62 | 58% | 11% | 31% | 1.855 | 2.952 | 2.081 | +0.871 | |
| Baker, Daniel* | 61 | 51% | 8% | 41% | 1.607 | 2.393 | 2.049 | +0.344 | |
| Currie, Fraser* | 60 | 48% | 10% | 42% | 1.550 | 3.317 | 2.450 | +0.867 | |
| Bonney, Michael* | 57 | 68% | 7% | 25% | 2.123 | 3.193 | 1.456 | +1.737 | |
| Lawrence, Riley* | 57 | 46% | 18% | 37% | 1.544 | 3.211 | 2.316 | +0.895 | |
| Lawrence, Tejay* | 56 | 50% | 18% | 32% | 1.679 | 3.321 | 2.161 | +1.161 | |
| Scalzo, Mark* | 48 | 42% | 21% | 38% | 1.458 | 3.000 | 2.313 | +0.688 | |
| Strobel, Joshua* | 47 | 55% | 13% | 32% | 1.787 | 3.723 | 2.191 | +1.532 | |
| Kelly, Lee* | 47 | 45% | 15% | 40% | 1.489 | 3.128 | 2.596 | +0.532 | |
| Darcy, Astin* | 46 | 39% | 11% | 50% | 1.283 | 2.152 | 2.783 | -0.630 | |
| Slocombe, Morgan* | 45 | 47% | 11% | 42% | 1.511 | 2.689 | 2.556 | +0.133 | |
| Vallance, Lachlan* | 42 | 43% | 12% | 45% | 1.405 | 3.143 | 2.524 | +0.619 | |
| Edwards, Jeremy* | 40 | 60% | 5% | 35% | 1.850 | 3.000 | 1.675 | +1.325 | |
| Graetz, Brian* | 39 | 36% | 18% | 46% | 1.256 | 1.487 | 2.128 | -0.641 | |
| Lawrence, Daryl* | 38 | 58% | 18% | 24% | 1.921 | 4.184 | 1.921 | +2.263 | |
| Gati, Nick* | 38 | 58% | 16% | 26% | 1.895 | 3.421 | 1.684 | +1.737 | |
| Lawrence, Stephen* | 38 | 53% | 8% | 39% | 1.658 | 3.579 | 2.658 | +0.921 | |
| Hanley-Wood, Ben* | 37 | 43% | 14% | 43% | 1.432 | 3.351 | 2.865 | +0.486 | |
| Crebbin, Jason* | 36 | 53% | 8% | 39% | 1.667 | 3.278 | 3.028 | +0.250 | |
| Strebs-Stelps, Ben* | 36 | 58% | 8% | 33% | 1.833 | 3.389 | 2.583 | +0.806 | |
| Cox, Caitlyn* | 34 | 59% | 6% | 35% | 1.824 | 3.088 | 2.176 | +0.912 | |
| MacKenzie, Darren* | 34 | 53% | 12% | 35% | 1.706 | 3.382 | 2.059 | +1.324 | |
| Dine, Brenton* | 32 | 75% | 3% | 22% | 2.281 | 3.719 | 1.313 | +2.406 | |
| Wilmshurst, Shaun* | 31 | 45% | 16% | 39% | 1.516 | 1.419 | 1.548 | -0.129 | |
| Knipe, Lucas* | 31 | 48% | 10% | 42% | 1.548 | 2.581 | 2.387 | +0.194 | |
| Bosquet, Dane* | 29 | 28% | 14% | 59% | 0.966 | 1.862 | 2.724 | -0.862 | |
| McMurrie, Michael* | 29 | 55% | 10% | 34% | 1.759 | 2.483 | 1.862 | +0.621 | |
| Sorensen, Steven* | 27 | 44% | 11% | 44% | 1.444 | 3.000 | 2.481 | +0.519 | |
| Kelly, Bo* | 27 | 44% | 7% | 48% | 1.407 | 2.741 | 3.111 | -0.370 | |
| VellaVanKassel, Chris* | 27 | 44% | 7% | 48% | 1.407 | 2.593 | 2.333 | +0.259 | |
| Downs, David* | 26 | 62% | 12% | 27% | 1.962 | 3.923 | 1.885 | +2.038 | |
| Kovarik, Hans* | 26 | 38% | 12% | 50% | 1.269 | 1.692 | 2.423 | -0.731 | |
| Darcy, Thurston* | 25 | 84% | 16% | 2.520 | 4.080 | 1.160 | +2.920 | ||
| Greed, Justin* | 25 | 56% | 12% | 32% | 1.800 | 3.640 | 1.720 | +1.920 | |
| Lawrence, Tony* | 24 | 63% | 4% | 33% | 1.917 | 3.708 | 2.208 | +1.500 | |
| Hooley, Ryan* | 24 | 54% | 13% | 33% | 1.750 | 2.708 | 2.125 | +0.583 | |
| Rodrigues, Errol* | 24 | 54% | 17% | 29% | 1.792 | 3.167 | 2.083 | +1.083 | |
| Salvatore, Aaron* | 24 | 54% | 13% | 33% | 1.750 | 3.167 | 1.667 | +1.500 | |
| Arnold, Chris* | 23 | 39% | 22% | 39% | 1.391 | 3.565 | 2.522 | +1.043 | |
| Bluschke, Alf* | 23 | 52% | 9% | 39% | 1.652 | 2.826 | 1.826 | +1.000 | |
| Haycock, John* | 23 | 43% | 22% | 35% | 1.522 | 3.043 | 2.391 | +0.652 | |
| McLaren, Scott* | 23 | 43% | 17% | 39% | 1.478 | 2.348 | 1.870 | +0.478 | |
| Lawrence, Glenn* | 22 | 50% | 14% | 36% | 1.636 | 3.545 | 2.455 | +1.091 | |
| Hocking, Branton* | 22 | 68% | 9% | 23% | 2.136 | 3.000 | 1.182 | +1.818 | |
| Lawrence, Geoffrey* | 22 | 59% | 9% | 32% | 1.864 | 3.500 | 2.591 | +0.909 | |
| MacKinnon, Robert* | 21 | 95% | 5% | 2.857 | 4.762 | 1.095 | +3.667 | ||
| Shelly-Robbins, James* | 20 | 65% | 15% | 20% | 2.100 | 2.950 | 1.250 | +1.700 | |
| Lawrence, Brody* | 19 | 37% | 21% | 42% | 1.316 | 2.737 | 2.526 | +0.211 | |
| Holahan, Lucy* | 18 | 56% | 11% | 33% | 1.778 | 1.556 | 1.111 | +0.444 | |
| Brazil, Sean* | 18 | 33% | 11% | 56% | 1.111 | 1.944 | 3.833 | -1.889 | |
| May, Adrian* | 17 | 47% | 53% | 1.412 | 2.118 | 2.941 | -0.824 | ||
| Micallef, Reuben* | 17 | 29% | 24% | 47% | 1.118 | 2.588 | 2.706 | -0.118 | |
| Shadbolt, Ron* | 16 | 31% | 19% | 50% | 1.125 | 2.125 | 2.250 | -0.125 | |
| Kasprzak, Alex* | 16 | 100% | 3.000 | 5.000 | 0.750 | +4.250 | |||
| McMurrie, Andrew* | 16 | 63% | 19% | 19% | 2.063 | 2.438 | 1.188 | +1.250 | |
| McMillan, Brent* | 16 | 69% | 19% | 13% | 2.250 | 3.000 | 1.000 | +2.000 | |
| Micallef, Levi* | 16 | 38% | 19% | 44% | 1.313 | 2.875 | 2.500 | +0.375 | |
| Mumford, Nicole* | 15 | 20% | 80% | 0.600 | 1.800 | 3.733 | -1.933 | ||
| May, Jarrod* | 15 | 27% | 20% | 53% | 1.000 | 1.067 | 2.267 | -1.200 | |
| Kovarik, John* | 15 | 47% | 53% | 1.400 | 2.600 | 2.733 | -0.133 | ||
| Eastwell, Josh* | 15 | 40% | 60% | 1.200 | 2.000 | 3.467 | -1.467 | ||
| Armitage, Callan* | 15 | 47% | 53% | 1.400 | 3.067 | 2.400 | +0.667 | ||
| Johnson, Shaun* | 14 | 71% | 14% | 14% | 2.286 | 2.571 | 0.786 | +1.786 | |
| Bennett, Graeme* | 14 | 50% | 21% | 29% | 1.714 | 3.286 | 1.929 | +1.357 | |
| Cook, Stuart* | 13 | 46% | 15% | 38% | 1.538 | 3.231 | 1.769 | +1.462 | |
| Kovarik, Brenda* | 13 | 15% | 85% | 0.154 | 0.538 | 3.308 | -2.769 | ||
| Arnold, David* | 13 | 46% | 31% | 23% | 1.692 | 2.462 | 1.692 | +0.769 | |
| Vallance, Liam* | 13 | 54% | 31% | 15% | 1.923 | 4.308 | 2.692 | +1.615 | |
| Gorton, David* | 13 | 54% | 15% | 31% | 1.769 | 2.692 | 2.077 | +0.615 | |
| Rance, Brendan* | 13 | 38% | 15% | 46% | 1.308 | 2.846 | 2.692 | +0.154 | |
| Block, Ashlea* | 12 | 50% | 50% | 1.500 | 1.917 | 2.833 | -0.917 | ||
| Granville, Alan* | 12 | 25% | 8% | 67% | 0.833 | 1.333 | 3.417 | -2.083 | |
| Agius, Jesse* | 12 | 58% | 8% | 33% | 1.833 | 3.917 | 2.333 | +1.583 | |
| Spence, Dion* | 12 | 50% | 17% | 33% | 1.667 | 3.000 | 1.917 | +1.083 | |
| Corban, Malcolm* | 12 | 42% | 17% | 42% | 1.417 | 2.583 | 2.667 | -0.083 | |
| Armitage, Timothy* | 12 | 42% | 17% | 42% | 1.417 | 2.250 | 2.083 | +0.167 | |
| Cameron, John* | 11 | 9% | 27% | 64% | 0.545 | 1.091 | 3.091 | -2.000 | |
| Baker, Gavin* | 11 | 55% | 45% | 1.636 | 2.273 | 1.909 | +0.364 | ||
| Knight, Jason* | 11 | 45% | 9% | 45% | 1.455 | 2.273 | 2.818 | -0.545 | |
| Bahramis, Zak* | 11 | 36% | 18% | 45% | 1.273 | 2.818 | 2.636 | +0.182 | |
| Fitzgerald, Tim* | 10 | 10% | 20% | 70% | 0.500 | 0.800 | 2.700 | -1.900 | |
| Rihs, Daniel* | 10 | 30% | 10% | 60% | 1.000 | 1.500 | 3.800 | -2.300 | |
| Lang, Joshua* | 10 | 80% | 20% | 2.600 | 2.900 | 0.700 | +2.200 | ||
| Strebs-Stelps, Leo* | 10 | 40% | 10% | 50% | 1.300 | 1.600 | 3.500 | -1.900 | |
| Jungfer, Kathy* | 9 | 22% | 11% | 67% | 0.778 | 1.444 | 4.222 | -2.778 | |
| James, William* | 9 | 44% | 11% | 44% | 1.444 | 2.556 | 2.556 | +0.000 | |
| Azzopardi, Justin* | 9 | 44% | 56% | 1.333 | 2.667 | 2.778 | -0.111 | ||
| Hu, Chun-Che* | 9 | 56% | 11% | 33% | 1.778 | 3.556 | 1.667 | +1.889 | |
| Dixon, Daniel* | 8 | 25% | 13% | 63% | 0.875 | 2.125 | 3.500 | -1.375 | |
| Hoad, Simon* | 8 | 50% | 25% | 25% | 1.750 | 3.250 | 1.875 | +1.375 | |
| McMurrie, Tom* | 8 | 38% | 13% | 50% | 1.250 | 2.750 | 2.625 | +0.125 | |
| Simpson, Matthew* | 8 | 50% | 50% | 1.500 | 2.625 | 3.000 | -0.375 | ||
| Dhillon, Paramjit* | 8 | 38% | 38% | 25% | 1.500 | 3.875 | 2.625 | +1.250 | |
| Hogg, Matthew* | 7 | 14% | 86% | 0.143 | 0.286 | 2.857 | -2.571 | ||
| Murphy, Mathew* | 7 | 43% | 57% | 1.286 | 3.000 | 3.143 | -0.143 | ||
| Singh, Parminder* | 7 | 43% | 29% | 29% | 1.571 | 4.143 | 2.714 | +1.429 | |
| Halligan, Alan* | 6 | 17% | 83% | 0.167 | 0.333 | 3.000 | -2.667 | ||
| Clotworthy, Joshua* | 6 | 67% | 33% | 2.000 | 3.500 | 2.333 | +1.167 | ||
| Stanyer, Adrian* | 5 | 40% | 20% | 40% | 1.400 | 3.200 | 2.400 | +0.800 | |
| Bell, Ray* | 5 | 40% | 60% | 0.400 | 1.000 | 2.200 | -1.200 | ||
| Griffiths, Rylee* | 5 | 60% | 40% | 1.800 | 2.200 | 2.000 | +0.200 | ||
| MacKinnon, Tim* | 4 | 50% | 25% | 25% | 1.750 | 3.000 | 2.000 | +1.000 | |
| Williams, Mark* | 4 | 25% | 25% | 50% | 1.000 | 1.000 | 1.250 | -0.250 | |
| Lawrence, Richard* | 4 | 25% | 25% | 50% | 1.000 | 1.250 | 3.250 | -2.000 | |
| Meehan, James* | 4 | 25% | 25% | 50% | 1.000 | 1.750 | 4.500 | -2.750 | |
| Abraham, Liam* | 4 | 25% | 50% | 25% | 1.250 | 2.750 | 2.750 | +0.000 | |
| Adhofoer, Hayley* | 3 | 67% | 33% | 2.333 | 2.333 | 0.333 | +2.000 | ||
| Graetz, Ashley* | 3 | 33% | 67% | 1.000 | 0.667 | 1.667 | -1.000 | ||
| Falcao, Hip* | 3 | 67% | 33% | 2.000 | 4.000 | 3.333 | +0.667 | ||
| Anderson, Matthew* | 3 | 67% | 33% | 2.333 | 5.000 | 1.000 | +4.000 | ||
| Moroney, Jason | 3 | 33% | 67% | 1.000 | 2.333 | 3.667 | -1.333 | ||
| James, Jeff* | 3 | 33% | 67% | 0.333 | 1.333 | 5.667 | -4.333 | ||
| Taylor, Harvey* | 3 | 100% | 3.000 | 4.000 | 1.333 | +2.667 | |||
| James, Daniel* | 3 | 100% | 0.000 | 1.667 | 4.667 | -3.000 | |||
| Bairstow, Michael* | 3 | 100% | 3.000 | 3.000 | 0.667 | +2.333 | |||
| Jennings, Ian* | 2 | 100% | 3.000 | 3.500 | 0.000 | +3.500 | |||
| Crebbin, Kylie* | 2 | 100% | 0.000 | 0.000 | 5.500 | -5.500 | |||
| Bluschke, Glen* | 2 | 100% | 3.000 | 3.000 | 0.000 | +3.000 | |||
| Anderson, Steven | 2 | 50% | 50% | 1.500 | 2.000 | 2.000 | +0.000 | ||
| Gill, Jack | 2 | 50% | 50% | 2.000 | 6.000 | 1.500 | +4.500 | ||
| VellaVanKassel, Nick* | 2 | 50% | 50% | 1.500 | 2.500 | 2.500 | +0.000 | ||
| Knight, Tristan* | 2 | 50% | 50% | 1.500 | 1.500 | 4.500 | -3.000 | ||
| Bentley, Myles* | 2 | 100% | 3.000 | 4.500 | 1.500 | +3.000 | |||
| Hart, Liam* | 2 | 100% | 3.000 | 4.500 | 1.500 | +3.000 | |||
| Brown, Chris* | 2 | 100% | 3.000 | 4.500 | 1.000 | +3.500 | |||
| Brown, Daniel* | 2 | 100% | 3.000 | 3.000 | 0.500 | +2.500 | |||
| Caiafa, Jackson* | 2 | 100% | 3.000 | 3.000 | 0.500 | +2.500 | |||
| Morris, Sebastian* | 2 | 100% | 3.000 | 3.000 | 0.500 | +2.500 | |||
| Downs, Cassandra* | 1 | 100% | 3.000 | 1.000 | 0.000 | +1.000 | |||
| Graetz, Chris* | 1 | 100% | 3.000 | 1.000 | 0.000 | +1.000 | |||
| Cautley, Mark* | 1 | 100% | 0.000 | 5.000 | 6.000 | -1.000 | |||
| Thomas, Liam* | 1 | 100% | 0.000 | 0.000 | 2.000 | -2.000 | |||
| Downs, Colleen* | 1 | 100% | 0.000 | 0.000 | 8.000 | -8.000 | |||
| Graetz, Jeff* | 1 | 100% | 3.000 | 3.000 | 2.000 | +1.000 | |||
| Brierley, John* | 1 | 100% | 3.000 | 4.000 | 2.000 | +2.000 | |||
| Kasprzak, Marcus* | 1 | 100% | 3.000 | 2.000 | 0.000 | +2.000 | |||
| Bluschke, Mark* | 1 | 100% | 0.000 | 4.000 | 5.000 | -1.000 | |||
| Powderly, Darryl* | 1 | 100% | 1.000 | 1.000 | 1.000 | +0.000 | |||
| O`Shae, Ryan* | 1 | 100% | 1.000 | 4.000 | 4.000 | +0.000 | |||
| Hobbs, Neil* | 1 | 100% | 0.000 | 0.000 | 2.000 | -2.000 | |||
| Lowing, Brayden* | 1 | 100% | 3.000 | 2.000 | 0.000 | +2.000 | |||
| Grant-Taylor, Sandy* | 1 | 100% | 0.000 | 0.000 | 5.000 | -5.000 | |||
| Berns, Alannah* | 1 | 100% | 0.000 | 0.000 | 8.000 | -8.000 | |||
| Murugan, Sankar | 1 | 100% | 3.000 | 6.000 | 1.000 | +5.000 | |||
| Closter, Seth* | 1 | 100% | 0.000 | 1.000 | 2.000 | -1.000 | |||
| Allen, Mark* | 1 | 100% | 3.000 | 3.000 | 0.000 | +3.000 | |||
| Bonnici, Benjamin* | 1 | 100% | 3.000 | 3.000 | 0.000 | +3.000 | |||
| Bonnici, Samuel* | 1 | 100% | 3.000 | 3.000 | 0.000 | +3.000 | |||
| Davis, Brett* | 1 | 100% | 3.000 | 3.000 | 0.000 | +3.000 | |||
| Holahan, Sebastian* | 1 | 100% | 3.000 | 3.000 | 0.000 | +3.000 | |||
| Simpson, Mitchell* | 1 | 100% | 3.000 | 3.000 | 0.000 | +3.000 | |||
| Altham, Shane* | 1 | 100% | 3.000 | 3.000 | 1.000 | +2.000 | |||
| Brown, Owen* | 1 | 100% | 3.000 | 3.000 | 1.000 | +2.000 | |||
| Cobbin, Troy* | 1 | 100% | 3.000 | 3.000 | 1.000 | +2.000 | |||
| Drozd, Logan* | 1 | 100% | 3.000 | 3.000 | 1.000 | +2.000 | |||
| Hermence, Jonah | 1 | 100% | 3.000 | 3.000 | 1.000 | +2.000 | |||
| Larcart, Houston* | 1 | 100% | 3.000 | 3.000 | 1.000 | +2.000 | |||
| Mifsud, Marcus* | 1 | 100% | 3.000 | 3.000 | 1.000 | +2.000 | |||
| Miller, Nicholas* | 1 | 100% | 3.000 | 3.000 | 1.000 | +2.000 | |||
| Pook, Michael* | 1 | 100% | 3.000 | 3.000 | 1.000 | +2.000 |
Opposition Teams
| Opponent |
Games |
Goals | Avge |
Win % | Draw % | Loss % | Unkn % | Avge. Points |
Avge. For | Avge. Aga | Avge. Diff. |
G.K. Games | Shut- outs | Shut- out % | Goals In | Goals Avge |
|---|---|---|---|---|---|---|---|---|---|---|---|---|---|---|---|---|
| Footscray | 32 | 13 | 0.406 | 34% | 16% | 50% | 1.188 | 2.281 | 2.750 | -0.469 | ||||||
| Essendon | 29 | 22 | 0.759 | 59% | 3% | 38% | 1.793 | 2.690 | 2.103 | +0.586 | ||||||
| Werribee | 21 | 11 | 0.524 | 48% | 14% | 38% | 1.571 | 2.286 | 2.429 | -0.143 | ||||||
| Altona | 20 | 6 | 0.300 | 45% | 20% | 35% | 1.550 | 2.600 | 2.900 | -0.300 | ||||||
| Yarra Valley | 19 | 12 | 0.632 | 68% | 16% | 16% | 2.211 | 3.158 | 1.316 | +1.842 | ||||||
| St.Bernards | 18 | 44% | 6% | 50% | 1.389 | 2.222 | 2.944 | -0.722 | ||||||||
| MUHC | 12 | 7 | 0.583 | 58% | 42% | 1.750 | 3.833 | 2.167 | +1.667 | |||||||
| RMIT | 12 | 3 | 0.250 | 50% | 25% | 25% | 1.750 | 3.167 | 2.083 | +1.083 | ||||||
| Hawthorn | 10 | 3 | 0.300 | 30% | 20% | 50% | 1.100 | 1.200 | 2.100 | -0.900 | ||||||
| Brunswick | 10 | 5 | 0.500 | 30% | 30% | 40% | 1.200 | 2.900 | 2.500 | +0.400 | ||||||
| Greensborough | 10 | 3 | 0.300 | 30% | 10% | 60% | 1.000 | 1.500 | 2.400 | -0.900 | ||||||
| Bayside | 10 | 40% | 20% | 40% | 1.400 | 2.700 | 2.200 | +0.500 | ||||||||
| PEGS | 9 | 2 | 0.222 | 56% | 44% | 1.667 | 2.111 | 2.111 | +0.000 | |||||||
| Box Hill | 7 | 57% | 43% | 1.714 | 2.429 | 1.857 | +0.571 | |||||||||
| Collegians-X | 7 | 29% | 14% | 57% | 1.000 | 2.571 | 2.429 | +0.143 | ||||||||
| Old Melburnians | 6 | 50% | 17% | 33% | 1.667 | 3.167 | 1.000 | +2.167 | ||||||||
| ECHO | 6 | 1 | 0.167 | 33% | 17% | 50% | 1.167 | 1.333 | 2.500 | -1.167 | ||||||
| Swinburne | 5 | 3 | 0.600 | 80% | 20% | 2.400 | 4.400 | 2.200 | +2.200 | |||||||
| Dandenong | 5 | 40% | 20% | 40% | 1.400 | 4.000 | 3.600 | +0.400 | ||||||||
| Latrobe Valley | 5 | 60% | 20% | 20% | 2.000 | 2.800 | 2.000 | +0.800 | ||||||||
| Old Haileybury | 4 | 1 | 0.250 | 100% | 3.000 | 3.000 | 0.750 | +2.250 | ||||||||
| Maccabi | 4 | 50% | 25% | 25% | 1.750 | 3.250 | 1.750 | +1.500 | ||||||||
| Caroline Springs | 4 | 75% | 25% | 2.250 | 3.000 | 1.000 | +2.000 | |||||||||
| MCC | 3 | 2 | 0.667 | 33% | 67% | 1.000 | 2.333 | 1.667 | +0.667 | |||||||
| Powerhouse | 3 | 1 | 0.333 | 33% | 33% | 33% | 1.333 | 2.333 | 4.000 | -1.667 | ||||||
| Vic Sihks | 3 | 33% | 67% | 0.333 | 2.333 | 4.333 | -2.000 | |||||||||
| Latrobe Uni | 3 | 2 | 0.667 | 100% | 3.000 | 6.000 | 0.000 | +6.000 | ||||||||
| St.Bedes | 3 | 33% | 67% | 0.333 | 1.333 | 5.333 | -4.000 | |||||||||
| Craigieburn | 3 | 33% | 67% | 1.000 | 2.000 | 3.000 | -1.000 | |||||||||
| Ballarat | 2 | 50% | 50% | 1.500 | 3.500 | 2.000 | +1.500 | |||||||||
| Doncaster | 2 | 2 | 1.000 | 50% | 50% | 1.500 | 1.500 | 1.500 | +0.000 | |||||||
| Camberwell | 2 | 1 | 0.500 | 100% | 3.000 | 2.500 | 1.000 | +1.500 | ||||||||
| Waverley | 2 | 2 | 1.000 | 100% | 3.000 | 8.500 | 0.500 | +8.000 | ||||||||
| Sandringham | 2 | 2 | 1.000 | 100% | 3.000 | 8.000 | 1.500 | +6.500 | ||||||||
| Eastern | 2 | 100% | 3.000 | 4.000 | 0.000 | +4.000 | ||||||||||
| SNP | 2 | 3 | 1.500 | 100% | 3.000 | 7.000 | 0.500 | +6.500 | ||||||||
| Lowther Hall | 2 | 4 | 2.000 | 100% | 3.000 | 7.500 | 1.000 | +6.500 | ||||||||
| Geelong | 2 | 1 | 0.500 | 50% | 50% | 1.500 | 2.000 | 3.000 | -1.000 | |||||||
| Mornington | 2 | 1 | 0.500 | 100% | 0.000 | 1.500 | 3.000 | -1.500 | ||||||||
| Old Carey | 2 | 50% | 50% | 1.500 | 4.500 | 1.500 | +3.000 | |||||||||
| Croydon | 2 | 100% | 3.000 | 5.500 | 1.500 | +4.000 | ||||||||||
| Frankston | 2 | 50% | 50% | 0.500 | 2.000 | 3.000 | -1.000 | |||||||||
| Aussie Punjabi | 2 | 100% | 0.000 | 1.000 | 2.000 | -1.000 | ||||||||||
| Razorbacks | 2 | 50% | 50% | 2.000 | 3.500 | 1.500 | +2.000 | |||||||||
| Reservoir | 1 | 100% | 1.000 | 0.000 | 0.000 | +0.000 | ||||||||||
| TEM | 1 | 1 | 1.000 | 100% | 0.000 | 1.000 | 4.000 | -3.000 | ||||||||
| Elwood | 1 | 100% | 0.000 | 2.000 | 5.000 | -3.000 | ||||||||||
| MHSOB | 1 | 100% | 3.000 | 3.000 | 2.000 | +1.000 | ||||||||||
| Kew | 1 | 100% | 0.000 | 4.000 | 5.000 | -1.000 | ||||||||||
| Bendigo | 1 | 1 | 1.000 | 100% | 0.000 | 2.000 | 5.000 | -3.000 | ||||||||
| Chadstone | 1 | 100% | 3.000 | 2.000 | 1.000 | +1.000 | ||||||||||
| Old Trinity | 1 | 100% | 0.000 | 1.000 | 4.000 | -3.000 | ||||||||||
| Knox | 1 | 100% | 0.000 | 0.000 | 9.000 | -9.000 | ||||||||||
| Melton | 1 | 100% | 0.000 | 1.000 | 2.000 | -1.000 | ||||||||||
| Glen Eira | 1 | 100% | 3.000 | 8.000 | 1.000 | +7.000 | ||||||||||
| Opponents :55 | 324 | 115 | 0.355 | 48% | 12% | 40% | 1.568 | 2.747 | 2.290 | +0.457 |
Playing Venues
| Venue | Games |
Goals | Avge. |
Win % | Draw % | Loss % | Unkn % | Avge. Points |
Avge. For | Avge. Aga | Avge. Diff. |
G.K. Games | Shut- outs | Shut- out % | Goals In | Goals Avge. |
|---|---|---|---|---|---|---|---|---|---|---|---|---|---|---|---|---|
| Melton Mowbray | 98 | 41 | 0.418 | 61% | 12% | 27% | 1.959 | 3.153 | 1.531 | +1.622 | ||||||
| Melton | 34 | 47% | 18% | 35% | 1.588 | 3.118 | 1.853 | +1.265 | ||||||||
| Footscray | 30 | 12 | 0.400 | 37% | 13% | 50% | 1.233 | 1.967 | 3.000 | -1.033 | ||||||
| Essendon | 21 | 19 | 0.905 | 62% | 10% | 29% | 1.952 | 3.286 | 2.143 | +1.143 | ||||||
| Altona Indoor | 14 | 11 | 0.786 | 21% | 7% | 71% | 0.714 | 2.143 | 4.786 | -2.643 | ||||||
| SHC | 14 | 4 | 0.286 | 43% | 21% | 36% | 1.500 | 3.357 | 2.643 | +0.714 | ||||||
| Werribee | 10 | 6 | 0.600 | 60% | 40% | 1.800 | 1.900 | 2.000 | -0.100 | |||||||
| Altona | 9 | 3 | 0.333 | 33% | 11% | 56% | 1.111 | 1.889 | 3.333 | -1.444 | ||||||
| St.Bernards | 9 | 22% | 22% | 56% | 0.889 | 1.778 | 3.222 | -1.444 | ||||||||
| Hawthorn | 7 | 3 | 0.429 | 57% | 14% | 29% | 1.857 | 2.429 | 2.143 | +0.286 | ||||||
| Elgar Park | 7 | 29% | 71% | 0.857 | 2.429 | 2.714 | -0.286 | |||||||||
| Melbourne High | 6 | 2 | 0.333 | 50% | 50% | 1.500 | 2.833 | 1.833 | +1.000 | |||||||
| Albert Park | 5 | 20% | 40% | 40% | 1.000 | 0.800 | 3.000 | -2.200 | ||||||||
| Yarra Valley | 5 | 2 | 0.400 | 60% | 40% | 1.800 | 2.800 | 2.400 | +0.400 | |||||||
| Waverley | 5 | 20% | 40% | 40% | 1.000 | 2.800 | 3.200 | -0.400 | ||||||||
| Greensborough | 4 | 25% | 75% | 0.750 | 1.000 | 2.750 | -1.750 | |||||||||
| Dandenong | 4 | 2 | 0.500 | 50% | 25% | 25% | 1.750 | 4.250 | 2.750 | +1.500 | ||||||
| Brunswick | 4 | 1 | 0.250 | 50% | 25% | 25% | 1.750 | 3.750 | 2.250 | +1.500 | ||||||
| Brighton | 4 | 25% | 75% | 0.750 | 2.500 | 2.750 | -0.250 | |||||||||
| Yarra Velodrome | 3 | 3 | 1.000 | 33% | 33% | 33% | 1.333 | 1.667 | 1.333 | +0.333 | ||||||
| Melbourne Uni | 3 | 1 | 0.333 | 33% | 67% | 1.000 | 5.000 | 3.333 | +1.667 | |||||||
| Reservoir | 3 | 100% | 3.000 | 1.667 | 0.000 | +1.667 | ||||||||||
| Melb Grammar | 3 | 67% | 33% | 2.000 | 4.667 | 1.667 | +3.000 | |||||||||
| Monash | 3 | 33% | 67% | 1.000 | 2.000 | 2.667 | -0.667 | |||||||||
| Knox | 2 | 50% | 50% | 1.500 | 2.000 | 4.500 | -2.500 | |||||||||
| PEGS | 2 | 2 | 1.000 | 100% | 3.000 | 3.500 | 1.500 | +2.000 | ||||||||
| Frankston | 2 | 100% | 0.000 | 1.500 | 3.500 | -2.000 | ||||||||||
| Hume | 2 | 50% | 50% | 1.500 | 2.500 | 2.500 | +0.000 | |||||||||
| Churchill | 2 | 50% | 50% | 1.500 | 3.000 | 3.000 | +0.000 | |||||||||
| Doncaster | 1 | 2 | 2.000 | 100% | 3.000 | 3.000 | 2.000 | +1.000 | ||||||||
| Ballarat | 1 | 100% | 0.000 | 2.000 | 4.000 | -2.000 | ||||||||||
| Geelong | 1 | 100% | 0.000 | 2.000 | 5.000 | -3.000 | ||||||||||
| Trinity | 1 | 100% | 0.000 | 1.000 | 4.000 | -3.000 | ||||||||||
| Haileybury | 1 | 1 | 1.000 | 100% | 3.000 | 1.000 | 0.000 | +1.000 | ||||||||
| Not Recorded | 1 | 100% | 0.000 | 1.000 | 1.000 | +0.000 | ||||||||||
| Yarra Grammar | 1 | 100% | 3.000 | 4.000 | 1.000 | +3.000 | ||||||||||
| Bundoora | 1 | 100% | 0.000 | 3.000 | 5.000 | -2.000 | ||||||||||
| Elwood | 1 | 100% | 1.000 | 2.000 | 2.000 | +0.000 | ||||||||||
| Venues :38 | 324 | 115 | 0.355 | 48% | 12% | 40% | 1.568 | 2.747 | 2.290 | +0.457 |