 |
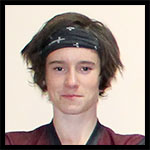
Melton Hockey Club |
|
Last updated : 8:44 am - 2 November 2023
Club Cap : 646
(Games : 179, Goals : 75 )
Games Umpired : 25
(Senior : 1, Veteran : 0, Junior : 24)
Milestones
| 2006-Apr-22 : | First game (Melton 2 def. Werribee (B) 0. R-01: 2006 U9 West) |
| 2006-Jul-29 : | First goal scored (Melton 5 def. Werribee (G) 3. R-13: 2006 U9 West) |
| 2009-Apr-18 : | 50 Junior games (MHSOB 4 def. Melton 0. R-01: 2009 U11 West) |
| 2011-Aug-06 : | First game umpired (Melton 5 def. Werribee 1. R-14: 2011 U11 West) |
| 2011-Sep-16 : | 100 Junior games (St.Bernards 3 def. Melton 1. GF: 2011 U13 West) |
| 2012-May-12 : | First Senior game (Latrobe Uni 12 def. Melton 0. R-05: 2012 Metro 3 West Men) |
| 2013-May-25 : | First Senior goal (Melton 2 def. Melton (B) 1. R-07: 2013 Metro 3 West (M)) |
| 2014-Jul-12 : | Last Senior game (Melton 2 def. PEGS 1. R-11: 2014 Metro 3 West Men) |
| 2014-Aug-16 : | Last game umpired (Melton 2 drew Footscray 2. R-13: 2014 U12 North/West) |
| 2014-Aug-22 : | 150 Junior games (Melton 2 def. Greensborough 0. R-14: 2014 U16 North/West) |
| 2014-Aug-29 : | Last game played (Essendon 2 def. Melton 1. SF: 2014 U16 North/West) |
| Playing career : 3051 days. (8 years and 131 days.) |
Honours, Trophies, and Official Roles
| Junior Sportsmanship : | 2007/08 |
| Top Junior Scorer (Win.) : | 2013/14 |
| Best and Fairest : | 2011-U13 West, 2014-U16 North/West |
| B&F Runner Up : | 2012-Metro 3 West Men |
| Captain : | 2010-U13 West, 2011-U13 West |
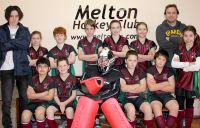
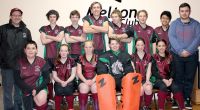
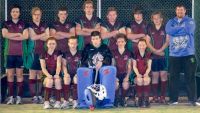
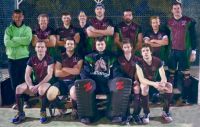
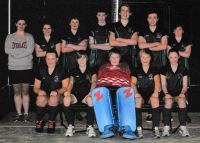
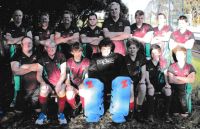
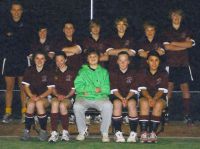
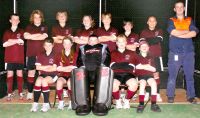
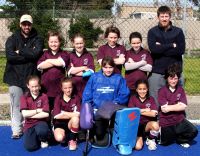
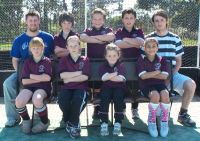
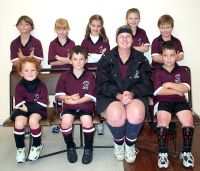
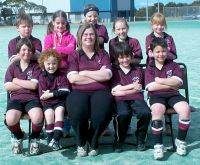
Team Photographs
Complete Playing History
Teams played with : 16
Premierships won : 0
Wooden Spoons : 1
| Games as Player |
Games Won | Games Drawn | Games Lost | Total | Goals | Goalscoring Average |
|---|---|---|---|---|---|---|
| Junior Winter | 64 | 17 | 62 | 143 | 72 | 0.503 |
| Junior Summer | 3 | 2 | 3 | 8 | 0 | 0.000 |
| Junior Total | 67 | 19 | 65 | 151 | 72 | 0.477 |
| Senior Winter | 10 | 4 | 14 | 28 | 3 | 0.107 |
| Total | 77 | 23 | 79 | 179 | 75 | 0.419 |
| Pos. | PR/WS | Div. | Competition | Games | Goals | Avge. | Won | Drawn | Lost | Avge.For | Avge.Aga | Avge.Diff | G.For | G.Aga | GoalDiff |
|---|---|---|---|---|---|---|---|---|---|---|---|---|---|---|---|
| 6 | 2014 Metro 3 West Men* | 1 | 1 | 2.000 | 1.000 | +1.000 | 2 | 1 | +001 | ||||||
| 4 | 2014 U16 North/West* | 12 | 14 | 1.167 | 9 | 1 | 2 | 2.750 | 1.083 | +1.667 | 33 | 13 | +020 | ||
| 7 | 2013 Vic League 3 Res. Men* | 1 | 1 | 0.000 | 6.000 | -6.000 | 0 | 6 | -006 | ||||||
| 3 | 2013 Metro 3 West (M)* | 13 | 3 | 0.231 | 6 | 3 | 4 | 2.077 | 1.615 | +0.462 | 27 | 21 | +006 | ||
| 5 | 2013 Metro 3 West (B)* | 4 | 2 | 1 | 1 | 1.750 | 1.750 | +0.000 | 7 | 7 | +000 | ||||
| 2 | 2013 U16 North/West* | 13 | 5 | 0.385 | 6 | 2 | 5 | 2.615 | 1.615 | +1.000 | 34 | 21 | +013 | ||
| 4 | 2012/13 U17 SHC | 8 | 3 | 2 | 3 | 1.500 | 1.875 | -0.375 | 12 | 15 | -003 | ||||
| 9 | 2012 Metro 3 West Men* | 9 | 1 | 8 | 1.556 | 5.444 | -3.889 | 14 | 49 | -035 | |||||
| 4 | 2012 U15 North/West* | 18 | 3 | 0.167 | 7 | 6 | 5 | 1.889 | 2.111 | -0.222 | 34 | 38 | -004 | ||
| 5 | 2011 U15 West* | 1 | 1 | 0.000 | 0.000 | +0.000 | 0 | 0 | +000 | ||||||
| 2 | 2011 U13 West* | 16 | 6 | 0.375 | 13 | 1 | 2 | 3.563 | 1.125 | +2.438 | 57 | 18 | +039 | ||
| 8 | 2010 U13 West* | 18 | 8 | 0.444 | 4 | 1 | 13 | 1.056 | 4.000 | -2.944 | 19 | 72 | -053 | ||
| 3 | 2009 U11 West* | 16 | 22 | 1.467 | 13 | 3 | 6.563 | 0.813 | +5.750 | 105 | 13 | +092 | |||
| 8 | WS | 2008 U11 Pennant North* | 17 | 2 | 0.118 | 2 | 1 | 14 | 0.294 | 4.118 | -3.824 | 5 | 70 | -065 | |
| 7 | 2007 U9 West* | 16 | 11 | 0.688 | 6 | 2 | 8 | 3.188 | 3.188 | +0.000 | 51 | 51 | +000 | ||
| 10 | 2006 U9 West* | 16 | 1 | 0.063 | 4 | 2 | 10 | 1.938 | 3.125 | -1.188 | 31 | 50 | -019 | ||
| 179 | 75 | 0.421 | 77 | 23 | 79 | 2.520 | 2.486 | -0.078 | 431 | 445 | -014 |
Goalkeeping History
| Games as Goalkeeper |
Games Won | Games Drawn | Games Lost | Total | Shut outs |
Shutout Average |
Goals Against |
G.A. Avg. |
|---|---|---|---|---|---|---|---|---|
| Junior Winter | 1 | 0 | 0 | 1 | 1 | 1.000 | 0 | 0.000 |
| Pos. | Div. | Competition | Games | Won | Drawn | Lost | Shutouts | % | Goals In | Avge. | GoalDiff |
|---|---|---|---|---|---|---|---|---|---|---|---|
| 3 | 2009 U11 West* | 1 | 1 | 1 | 100% | 0.000 | +010 |
Umpiring History
Year    Division                      SEN VET JUN
2011    U11 West                                3
2012    U9 West (2)                             1
2012    U9 West (1)                             4
2013    U10 B West                              4
2013    U10 A North/West                        2
2013    U12 North/West                          1
2014    U12 North/West                          9
2014    Metro 3 North/West Women        1

SUBTOTAL                                1      24
TOTAL                                          25
Junior Winter Playing History
| Games as Player |
Games Won | Games Drawn | Games Lost | Total | Goals | Goalscoring Average |
|---|---|---|---|---|---|---|
| Junior Winter | 64 | 17 | 62 | 143 | 72 | 0.503 |
| First Game : | Melton 2 def. Werribee (B) 0. R-01: 2006 U9 West |
| Last Game : | Essendon 2 def. Melton 1. SF: 2014 U16 North/West |
| Best Win : | Melton 14 def. Brunswick 0. R-14: 2009 U11 West |
| Worst Loss : | Footscray (R) 12 def. Melton 0. R-03: 2010 U13 West |
| 1 goal games : | 27 times. Last : Essendon 2 def. Melton 1. SF: 2014 U16 North/West |
| 2 goal games : | 13 times. Last : Melton 2 def. Greensborough 0. R-14: 2014 U16 North/West |
| 3 goal games : | 5 times. Last : Melton 3 def. St.Bernards 1. R-11: 2014 U16 North/West |
| 4 goal games : | 1 times. Last : Melton 9 def. Werribee (G) 0. R-09: 2007 U9 West |
| Finals : | Footscray (B) 2 def. Melton 1. SF: 2009 U11 West St.Bernards 3 def. Melton 1. GF: 2011 U13 West Melton 4 def. Essendon 0. SF: 2011 U13 West Werribee 4 def. Melton 0. SF: 2012 U15 North/West Werribee 3 def. Melton 1. GF: 2013 U16 North/West Melton 4 def. St.Bernards 0. SF: 2013 U16 North/West Essendon 2 def. Melton 1. SF: 2014 U16 North/West |
| Premierships : | None. |
Junior Summer Playing History
| Games as Player |
Games Won | Games Drawn | Games Lost | Total | Goals | Goalscoring Average |
|---|---|---|---|---|---|---|
| Junior Summer | 3 | 2 | 3 | 8 | 0 | 0.000 |
| First Game : | Melton 2 def. Essendon (B) 0. R-01: 2012/13 U17 SHC |
| Last Game : | Essendon 2 def. Melton 1. SF: 2012/13 U17 SHC |
| Best Win : | Melton 3 def. Southern United 1. R-08: 2012/13 U17 SHC |
| Worst Loss : | Essendon 5 def. Melton 0. R-07: 2012/13 U17 SHC |
| Finals : | Essendon 2 def. Melton 1. SF: 2012/13 U17 SHC |
| Premierships : | None. |
Senior Winter Playing History
| Games as Player |
Games Won | Games Drawn | Games Lost | Total | Goals | Goalscoring Average |
|---|---|---|---|---|---|---|
| Senior Winter | 10 | 4 | 14 | 28 | 3 | 0.107 |
| First Game : | Latrobe Uni 12 def. Melton 0. R-05: 2012 Metro 3 West Men |
| Last Game : | Melton 2 def. PEGS 1. R-11: 2014 Metro 3 West Men |
| Best Win : | Melton 8 def. Footscray (R) 1. EF: 2013 Metro 3 West (M) |
| Worst Loss : | Latrobe Uni 12 def. Melton 0. R-05: 2012 Metro 3 West Men |
| 1 goal games : | 3 times. Last : Melton 8 def. Footscray (R) 1. EF: 2013 Metro 3 West (M) |
| Finals : | Melton 8 def. Footscray (R) 1. EF: 2013 Metro 3 West (M) Werribee (B) 3 def. Melton 1. PF: 2013 Metro 3 West (M) |
| Premierships : | None. |
Teammates
Number of teammates :106
| Player |
Games |
Win % | Draw % | Loss % | Unkn % | Avge. Points |
Avge. For | Avge. Aga | Avge. Diff. |
|---|---|---|---|---|---|---|---|---|---|
| Knipe, Lucas* | 162 | 43% | 11% | 46% | 1.389 | 2.488 | 2.605 | -0.117 | |
| Martin, Liam* | 84 | 56% | 12% | 32% | 1.798 | 2.905 | 1.917 | +0.988 | |
| Salvatore, Joel | 82 | 55% | 9% | 37% | 1.732 | 3.378 | 2.134 | +1.244 | |
| Berns, Alannah* | 82 | 51% | 16% | 33% | 1.695 | 2.280 | 1.915 | +0.366 | |
| Henderson, Bayley* | 58 | 50% | 14% | 36% | 1.638 | 3.052 | 2.293 | +0.759 | |
| Park, Macey* | 52 | 46% | 8% | 46% | 1.462 | 3.500 | 2.596 | +0.904 | |
| Morcos, Aimee* | 48 | 44% | 6% | 50% | 1.375 | 3.354 | 2.729 | +0.625 | |
| Smith, Shannon* | 48 | 56% | 4% | 40% | 1.729 | 3.354 | 2.208 | +1.146 | |
| Vallance, Lachlan* | 42 | 31% | 17% | 52% | 1.095 | 1.881 | 2.595 | -0.714 | |
| Taylor, Harvey* | 35 | 74% | 14% | 11% | 2.371 | 3.114 | 1.371 | +1.743 | |
| Pell, Victoria* | 33 | 45% | 3% | 52% | 1.394 | 3.333 | 2.515 | +0.818 | |
| Pugh, Taylah* | 32 | 31% | 13% | 56% | 1.063 | 2.563 | 3.156 | -0.594 | |
| James, Daniel* | 32 | 75% | 6% | 19% | 2.313 | 3.031 | 1.313 | +1.719 | |
| Schwarze, Amy* | 32 | 75% | 6% | 19% | 2.313 | 3.031 | 1.281 | +1.750 | |
| Hinch, Benjamin* | 31 | 55% | 3% | 42% | 1.677 | 3.968 | 2.000 | +1.968 | |
| Lawrence, Casey* | 31 | 29% | 13% | 58% | 1.000 | 1.613 | 2.935 | -1.323 | |
| Spano, Luke* | 31 | 42% | 26% | 32% | 1.516 | 2.194 | 1.903 | +0.290 | |
| McMurrie, Michael* | 30 | 37% | 17% | 47% | 1.267 | 1.833 | 2.533 | -0.700 | |
| Rance, Brendan* | 29 | 41% | 24% | 34% | 1.483 | 2.207 | 2.034 | +0.172 | |
| Kelly, Lee* | 25 | 36% | 28% | 36% | 1.360 | 1.640 | 1.800 | -0.160 | |
| Humphrey, Hayden | 24 | 25% | 29% | 46% | 1.042 | 1.500 | 3.167 | -1.667 | |
| Griffiths, Rylee* | 24 | 33% | 21% | 46% | 1.208 | 1.500 | 2.042 | -0.542 | |
| Phillips, Chad* | 23 | 39% | 26% | 35% | 1.435 | 2.043 | 1.609 | +0.435 | |
| Fawcett, Tom* | 22 | 18% | 5% | 77% | 0.591 | 1.182 | 4.227 | -3.045 | |
| Price, Billie* | 22 | 36% | 32% | 32% | 1.409 | 1.818 | 2.227 | -0.409 | |
| Simpson, Matthew* | 21 | 38% | 14% | 48% | 1.286 | 1.762 | 2.952 | -1.190 | |
| Shelly-Robbins, James* | 20 | 55% | 20% | 25% | 1.850 | 2.200 | 1.450 | +0.750 | |
| Gauci, Natasha* | 18 | 17% | 11% | 72% | 0.611 | 0.944 | 4.000 | -3.056 | |
| Lawrence, Darcy* | 18 | 28% | 72% | 0.833 | 1.222 | 3.833 | -2.611 | ||
| Lowing, Brayden* | 18 | 44% | 22% | 33% | 1.556 | 2.167 | 1.667 | +0.500 | |
| Court, Emma* | 17 | 12% | 6% | 82% | 0.412 | 0.294 | 4.118 | -3.824 | |
| Currie, Fraser* | 17 | 53% | 24% | 24% | 1.824 | 2.000 | 1.412 | +0.588 | |
| Strebs-Stelps, Leo* | 17 | 24% | 6% | 71% | 0.765 | 1.471 | 4.059 | -2.588 | |
| Pugh, Ebony* | 16 | 25% | 13% | 63% | 0.875 | 1.938 | 3.125 | -1.188 | |
| Muscat, Madeline* | 16 | 13% | 6% | 81% | 0.438 | 0.188 | 4.000 | -3.813 | |
| Kovarik, Hans* | 15 | 27% | 13% | 60% | 0.933 | 1.533 | 3.800 | -2.267 | |
| Clotworthy, Georgia* | 14 | 43% | 7% | 50% | 1.357 | 3.429 | 3.143 | +0.286 | |
| Haycock, John* | 14 | 43% | 21% | 36% | 1.500 | 1.929 | 1.571 | +0.357 | |
| Crebbin, Jason* | 14 | 50% | 21% | 29% | 1.714 | 2.214 | 1.786 | +0.429 | |
| Lowing, Harrison | 14 | 43% | 36% | 21% | 1.643 | 2.071 | 2.000 | +0.071 | |
| Saunders, Brendan | 14 | 43% | 36% | 21% | 1.643 | 1.714 | 1.857 | -0.143 | |
| Knight, Tristan* | 14 | 71% | 7% | 21% | 2.214 | 2.571 | 1.357 | +1.214 | |
| Hobbs, Ebony* | 13 | 15% | 8% | 77% | 0.538 | 0.385 | 3.308 | -2.923 | |
| Docherty, Benjamin* | 13 | 23% | 15% | 62% | 0.846 | 1.385 | 3.615 | -2.231 | |
| Hooley, Ryan* | 13 | 46% | 15% | 38% | 1.538 | 2.000 | 2.538 | -0.538 | |
| Roberts, Jackson | 12 | 83% | 17% | 2.500 | 7.083 | 0.667 | +6.417 | ||
| Roberts, Mitchell* | 12 | 83% | 17% | 2.500 | 7.083 | 0.667 | +6.417 | ||
| Cullen, Helen* | 12 | 33% | 8% | 58% | 1.083 | 1.167 | 2.833 | -1.667 | |
| Caple, Madeline | 12 | 83% | 8% | 8% | 2.583 | 3.750 | 0.917 | +2.833 | |
| Alchin, Brent* | 11 | 9% | 9% | 82% | 0.364 | 0.091 | 4.000 | -3.909 | |
| Sagert, Lachlan | 11 | 82% | 9% | 9% | 2.545 | 4.091 | 1.091 | +3.000 | |
| Arnold, David* | 11 | 36% | 64% | 1.091 | 1.909 | 3.727 | -1.818 | ||
| Murphy, Mathew* | 11 | 45% | 27% | 27% | 1.636 | 1.909 | 1.364 | +0.545 | |
| Knight, Jason* | 11 | 36% | 27% | 36% | 1.364 | 2.000 | 1.909 | +0.091 | |
| Kelly, Jessica* | 11 | 45% | 18% | 36% | 1.545 | 2.545 | 1.455 | +1.091 | |
| Crowe, Douglas* | 10 | 100% | 0.000 | 0.200 | 4.900 | -4.700 | |||
| Downes, Billie* | 10 | 80% | 10% | 10% | 2.500 | 2.600 | 0.700 | +1.900 | |
| James, William* | 9 | 78% | 22% | 2.333 | 2.889 | 1.333 | +1.556 | ||
| Strebs-Stelps, Ben* | 9 | 33% | 22% | 44% | 1.222 | 1.444 | 2.556 | -1.111 | |
| Gorton, David* | 9 | 56% | 22% | 22% | 1.889 | 2.556 | 1.333 | +1.222 | |
| Hoskins, Kathryn* | 8 | 13% | 13% | 75% | 0.500 | 1.250 | 3.000 | -1.750 | |
| Mendez, Dan* | 8 | 25% | 75% | 0.750 | 1.875 | 3.250 | -1.375 | ||
| Cook, Stuart* | 8 | 25% | 75% | 0.750 | 1.875 | 5.125 | -3.250 | ||
| Eastwell, Josh* | 8 | 25% | 25% | 50% | 1.000 | 1.125 | 2.500 | -1.375 | |
| Sorensen, Steven* | 8 | 63% | 13% | 25% | 2.000 | 2.875 | 1.500 | +1.375 | |
| Davies, Nikita* | 8 | 63% | 13% | 25% | 2.000 | 2.625 | 1.375 | +1.250 | |
| Rodrigues, Renzo* | 7 | 71% | 29% | 2.143 | 2.429 | 1.143 | +1.286 | ||
| Schembri-Crisp, Leelou* | 7 | 71% | 14% | 14% | 2.286 | 2.857 | 1.143 | +1.714 | |
| Holahan, Zac* | 6 | 67% | 33% | 2.000 | 3.500 | 2.333 | +1.167 | ||
| Hart, Liam* | 6 | 100% | 3.000 | 3.833 | 1.000 | +2.833 | |||
| Martin, Scott* | 5 | 20% | 80% | 0.600 | 0.200 | 4.800 | -4.600 | ||
| Gray, Deane | 5 | 40% | 60% | 1.200 | 2.200 | 3.800 | -1.600 | ||
| McLaren, Scott* | 4 | 50% | 50% | 1.500 | 3.500 | 4.250 | -0.750 | ||
| Lawrence, Geoffrey* | 4 | 50% | 25% | 25% | 1.750 | 1.250 | 1.500 | -0.250 | |
| VellaVanKassel, Nick* | 3 | 33% | 67% | 0.333 | 0.000 | 6.000 | -6.000 | ||
| Arnold, Chris* | 3 | 100% | 0.000 | 2.333 | 6.667 | -4.333 | |||
| Shadbolt, Ron* | 3 | 33% | 33% | 33% | 1.333 | 2.333 | 3.000 | -0.667 | |
| Clough, Jarryd* | 3 | 100% | 0.000 | 0.667 | 3.667 | -3.000 | |||
| Meehan, James* | 3 | 33% | 33% | 33% | 1.333 | 1.000 | 2.000 | -1.000 | |
| Kasprzak, Marcus* | 3 | 33% | 33% | 33% | 1.333 | 1.000 | 2.000 | -1.000 | |
| Hoad, Simon* | 2 | 100% | 0.000 | 0.500 | 4.000 | -3.500 | |||
| James, Jeff* | 2 | 100% | 0.000 | 2.500 | 6.000 | -3.500 | |||
| Self, Ryan* | 2 | 50% | 50% | 1.500 | 2.500 | 3.000 | -0.500 | ||
| Fletcher-Gass, Jesse* | 2 | 50% | 50% | 2.000 | 3.500 | 2.500 | +1.000 | ||
| Downes, Cheyenne* | 1 | 100% | 3.000 | 2.000 | 0.000 | +2.000 | |||
| Thompson, Malachi* | 1 | 100% | 3.000 | 6.000 | 0.000 | +6.000 | |||
| Chisholm, Jack* | 1 | 100% | 1.000 | 0.000 | 0.000 | +0.000 | |||
| Derbass, Caitlyn* | 1 | 100% | 1.000 | 0.000 | 0.000 | +0.000 | |||
| Gati, Nick* | 1 | 100% | 0.000 | 0.000 | 1.000 | -1.000 | |||
| Strobel, Joshua* | 1 | 100% | 0.000 | 0.000 | 4.000 | -4.000 | |||
| Downs, David* | 1 | 100% | 3.000 | 5.000 | 0.000 | +5.000 | |||
| Hooley, Aidan* | 1 | 100% | 0.000 | 1.000 | 6.000 | -5.000 | |||
| James, Kylie-Faye* | 1 | 100% | 0.000 | 1.000 | 6.000 | -5.000 | |||
| Lawrence, Jesse* | 1 | 100% | 0.000 | 0.000 | 6.000 | -6.000 | |||
| May, Adrian* | 1 | 100% | 0.000 | 0.000 | 6.000 | -6.000 | |||
| McMillan, Brent* | 1 | 100% | 0.000 | 0.000 | 6.000 | -6.000 | |||
| Corban, Malcolm* | 1 | 100% | 0.000 | 1.000 | 3.000 | -2.000 | |||
| Rodrigues, Errol* | 1 | 100% | 1.000 | 1.000 | 1.000 | +0.000 | |||
| Grant-Taylor, Sandy* | 1 | 100% | 0.000 | 1.000 | 5.000 | -4.000 | |||
| Baxter, Peter* | 1 | 100% | 3.000 | 2.000 | 1.000 | +1.000 | |||
| Lawrence, Glenn* | 1 | 100% | 3.000 | 2.000 | 1.000 | +1.000 | |||
| Lawrence, Tony* | 1 | 100% | 3.000 | 2.000 | 1.000 | +1.000 | |||
| Patterson, Dylan | 1 | 100% | 3.000 | 2.000 | 1.000 | +1.000 | |||
| Lawrence, Hayden* | 1 | 100% | 0.000 | 1.000 | 2.000 | -1.000 | |||
| Gerding-Shaw, Dorian | 1 | 100% | 3.000 | 2.000 | 1.000 | +1.000 | |||
| Knott, Ruben* | 1 | 100% | 3.000 | 5.000 | 0.000 | +5.000 |
Opposition Teams
| Opponent |
Games |
Goals | Avge |
Win % | Draw % | Loss % | Unkn % | Avge. Points |
Avge. For | Avge. Aga | Avge. Diff. |
G.K. Games | Shut- outs | Shut- out % | Goals In | Goals Avge |
|---|---|---|---|---|---|---|---|---|---|---|---|---|---|---|---|---|
| Footscray | 43 | 15 | 0.349 | 44% | 9% | 47% | 1.419 | 2.628 | 3.047 | -0.419 | ||||||
| Werribee | 29 | 15 | 0.517 | 38% | 7% | 55% | 1.207 | 2.793 | 2.793 | +0.000 | ||||||
| Essendon | 23 | 10 | 0.435 | 39% | 17% | 43% | 1.348 | 1.870 | 1.913 | -0.043 | ||||||
| Altona | 22 | 5 | 0.227 | 18% | 18% | 64% | 0.727 | 1.773 | 3.273 | -1.500 | 1 | 1 | 100% | 0 | 0.000 | |
| Brunswick | 15 | 6 | 0.400 | 60% | 33% | 7% | 2.133 | 3.800 | 1.067 | +2.733 | ||||||
| St.Bernards | 13 | 10 | 0.769 | 62% | 38% | 1.846 | 2.462 | 1.846 | +0.615 | |||||||
| Box Hill | 7 | 1 | 0.143 | 14% | 43% | 43% | 0.857 | 1.714 | 2.571 | -0.857 | ||||||
| Greensborough | 5 | 4 | 0.800 | 60% | 20% | 20% | 2.000 | 2.000 | 1.200 | +0.800 | ||||||
| Yarra Valley | 4 | 75% | 25% | 2.250 | 2.250 | 0.750 | +1.500 | |||||||||
| Ajax-Maccabi | 2 | 100% | 0.000 | 0.000 | 6.500 | -6.500 | ||||||||||
| MHSOB | 2 | 2 | 1.000 | 50% | 50% | 1.500 | 2.500 | 3.000 | -0.500 | |||||||
| TEM | 2 | 3 | 1.500 | 100% | 3.000 | 5.500 | 0.000 | +5.500 | ||||||||
| Powerhouse | 2 | 3 | 1.500 | 100% | 3.000 | 3.500 | 0.500 | +3.000 | ||||||||
| PEGS | 2 | 50% | 50% | 1.500 | 1.000 | 3.500 | -2.500 | |||||||||
| Melton | 2 | 1 | 0.500 | 100% | 3.000 | 2.000 | 0.500 | +1.500 | ||||||||
| Southern United | 2 | 50% | 50% | 1.500 | 2.500 | 2.500 | +0.000 | |||||||||
| Kew | 1 | 100% | 3.000 | 1.000 | 0.000 | +1.000 | ||||||||||
| Camberwell | 1 | 100% | 0.000 | 0.000 | 3.000 | -3.000 | ||||||||||
| Latrobe Uni | 1 | 100% | 0.000 | 0.000 | 12.000 | -12.000 | ||||||||||
| MUHC | 1 | 100% | 0.000 | 0.000 | 2.000 | -2.000 | ||||||||||
| Opponents :20 | 179 | 75 | 0.419 | 43% | 13% | 44% | 1.419 | 2.408 | 2.486 | -0.078 | 1 | 1 | 100% | 0 | 0.000 |
Playing Venues
| Venue | Games |
Goals | Avge. |
Win % | Draw % | Loss % | Unkn % | Avge. Points |
Avge. For | Avge. Aga | Avge. Diff. |
G.K. Games | Shut- outs | Shut- out % | Goals In | Goals Avge. |
|---|---|---|---|---|---|---|---|---|---|---|---|---|---|---|---|---|
| Melton Mowbray | 82 | 38 | 0.463 | 45% | 12% | 43% | 1.476 | 2.683 | 2.573 | +0.110 | 1 | 1 | 100% | 0 | 0.000 | |
| Footscray | 25 | 7 | 0.280 | 44% | 8% | 48% | 1.400 | 2.640 | 2.880 | -0.240 | ||||||
| Essendon | 15 | 8 | 0.533 | 27% | 7% | 67% | 0.867 | 1.333 | 2.467 | -1.133 | ||||||
| Werribee | 13 | 9 | 0.692 | 46% | 8% | 46% | 1.462 | 3.462 | 2.692 | +0.769 | ||||||
| SHC | 12 | 1 | 0.083 | 33% | 42% | 25% | 1.417 | 1.750 | 1.500 | +0.250 | ||||||
| Brunswick | 8 | 2 | 0.250 | 50% | 38% | 13% | 1.875 | 2.500 | 1.000 | +1.500 | ||||||
| Altona | 7 | 2 | 0.286 | 29% | 14% | 57% | 1.000 | 1.000 | 3.143 | -2.143 | ||||||
| St.Bernards | 5 | 2 | 0.400 | 80% | 20% | 2.400 | 3.000 | 1.200 | +1.800 | |||||||
| Albert Park | 2 | 1 | 0.500 | 50% | 50% | 1.500 | 1.500 | 1.500 | +0.000 | |||||||
| Yarra Valley | 2 | 50% | 50% | 1.500 | 0.500 | 0.500 | +0.000 | |||||||||
| Greensborough | 2 | 3 | 1.500 | 100% | 3.000 | 2.500 | 0.500 | +2.000 | ||||||||
| Elgar Park | 1 | 100% | 0.000 | 0.000 | 5.000 | -5.000 | ||||||||||
| Hawthorn | 1 | 100% | 0.000 | 2.000 | 6.000 | -4.000 | ||||||||||
| Melbourne High | 1 | 2 | 2.000 | 100% | 3.000 | 6.000 | 0.000 | +6.000 | ||||||||
| Reservoir | 1 | 100% | 0.000 | 0.000 | 12.000 | -12.000 | ||||||||||
| Melbourne Uni | 1 | 100% | 0.000 | 0.000 | 2.000 | -2.000 | ||||||||||
| PSF | 1 | 100% | 0.000 | 0.000 | 6.000 | -6.000 | ||||||||||
| Venues :17 | 179 | 75 | 0.419 | 43% | 13% | 44% | 1.419 | 2.408 | 2.486 | -0.078 | 1 | 1 | 100% | 0 | 0.000 |